
- Start >
- Rivers >
- Discharge >
- Regnitz >
- Kreppendorf >
- Chart of year

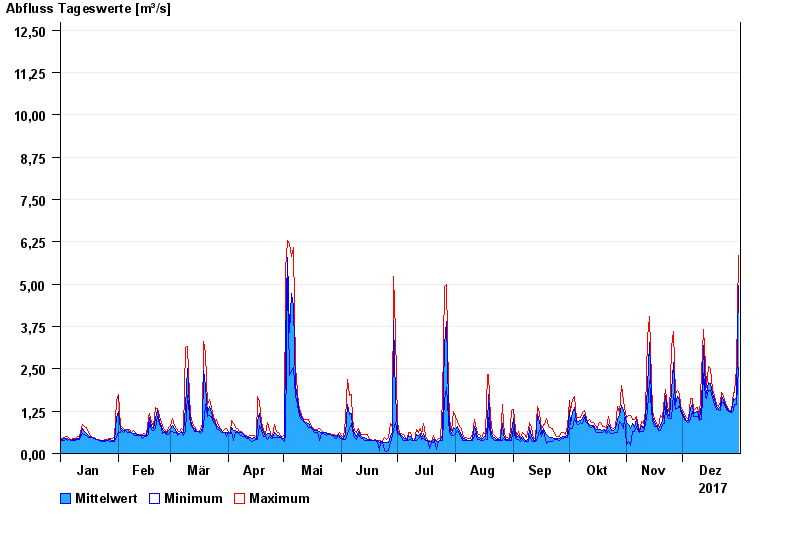
Chart of year Kreppendorf / Zenn
Discharge from 01.01.2017 to 31.12.2017
- HQ1 23 m³/s
- HQ2 36 m³/s
- HQ5 49 m³/s
- HQ10 63 m³/s
- HQ20 77 m³/s
- HQ50 98 m³/s
- HQ100 115 m³/s
| Date | Mean value [m³/s] | Maximum [m³/s] | Minimum [m³/s] |
|---|---|---|---|
| 31.12.2017 | 4.97 | 5.86 | 2.54 |
| 30.12.2017 | 1.64 | 2.54 | 1.44 |
| 29.12.2017 | 1.59 | 1.8 | 1.44 |
| 28.12.2017 | 1.62 | 1.8 | 1.28 |
| 27.12.2017 | 1.24 | 1.28 | 1.2 |
| 26.12.2017 | 1.26 | 1.28 | 1.24 |
| 25.12.2017 | 1.31 | 1.35 | 1.28 |
© Bayerisches Landesamt für Umwelt 2024