
- Start >
- Rivers >
- Discharge >
- Regnitz >
- Kreppendorf >
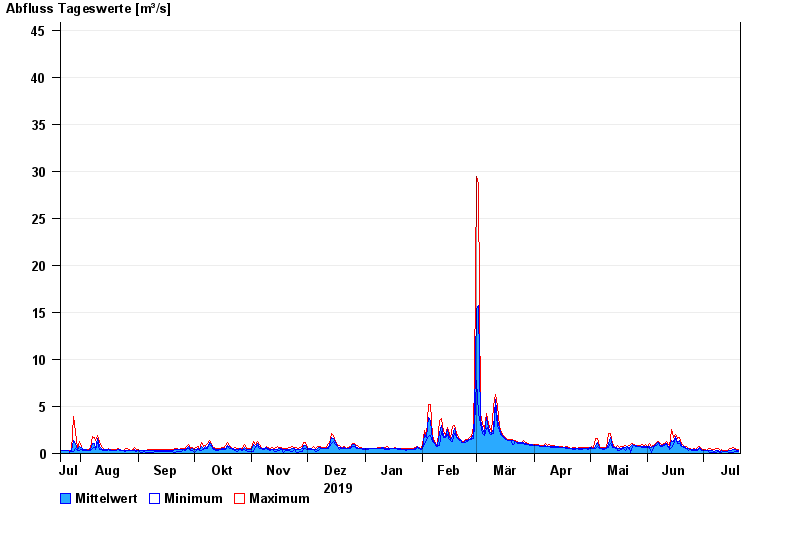
- Chart of year

Chart of year Kreppendorf / Zenn
Discharge from 21.07.2019 to 20.07.2020
- 21.12.1993 Abfluss: 102 m³/s
- 09.07.2021 Abfluss: 95,9 m³/s
- 21.03.2002 Abfluss: 67,5 m³/s
- 24.05.1978 Abfluss: 66,3 m³/s
- 29.10.1998 Abfluss: 65,5 m³/s
| Date | Mean value [m³/s] | Maximum [m³/s] | Minimum [m³/s] |
|---|---|---|---|
| 20.07.2020 | 0.282 | 0.382 | 0.25 |
| 19.07.2020 | 0.3 | 0.36 | 0.25 |
| 18.07.2020 | 0.378 | 0.48 | 0.25 |
| 17.07.2020 | 0.45 | 0.591 | 0.078 |
| 16.07.2020 | 0.358 | 0.535 | 0.072 |
| 15.07.2020 | 0.279 | 0.48 | 0.084 |
| 14.07.2020 | 0.246 | 0.32 | 0.235 |
© Bayerisches Landesamt für Umwelt 2024