
- Start >
- Rivers >
- Discharge >
- Regnitz >
- Kreppendorf >
- Chart of year

Chart of year Kreppendorf / Zenn
Discharge from 21.01.2021 to 20.01.2022
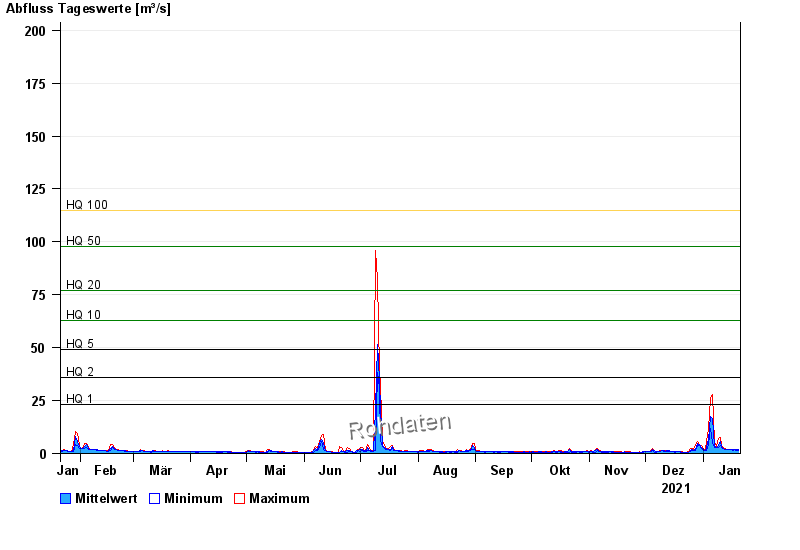
- HQ1 23 m³/s
- HQ2 36 m³/s
- HQ5 49 m³/s
- HQ10 63 m³/s
- HQ20 77 m³/s
- HQ50 98 m³/s
- HQ100 115 m³/s
| Date | Mean value [m³/s] | Maximum [m³/s] | Minimum [m³/s] |
|---|---|---|---|
| 20.01.2022 | 1.76 | 1.88 | 1.6 |
| 19.01.2022 | 1.69 | 1.78 | 1.6 |
| 18.01.2022 | 1.84 | 1.92 | 1.69 |
| 17.01.2022 | 1.7 | 1.73 | 1.64 |
| 16.01.2022 | 1.79 | 1.83 | 1.73 |
| 15.01.2022 | 1.84 | 1.88 | 1.78 |
| 14.01.2022 | 1.91 | 2.02 | 1.83 |
© Bayerisches Landesamt für Umwelt 2024