
- Start >
- Rivers >
- Discharge >
- Regnitz >
- Kreppendorf >
- Chart of year

Chart of year Kreppendorf / Zenn
Discharge from 01.01.2020 to 31.12.2020
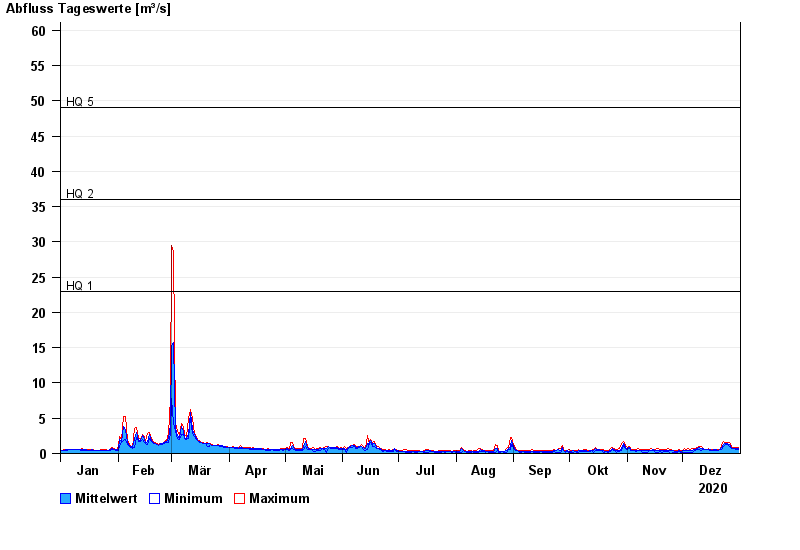
- HQ1 23 m³/s
- HQ2 36 m³/s
- HQ5 49 m³/s
- HQ10 63 m³/s
- HQ20 77 m³/s
- HQ50 98 m³/s
- HQ100 115 m³/s
| Date | Mean value [m³/s] | Maximum [m³/s] | Minimum [m³/s] |
|---|---|---|---|
| 31.12.2020 | 0.667 | 0.781 | 0.598 |
| 30.12.2020 | 0.726 | 0.811 | 0.595 |
| 29.12.2020 | 0.744 | 0.842 | 0.682 |
| 28.12.2020 | 0.754 | 0.806 | 0.71 |
| 27.12.2020 | 0.848 | 0.971 | 0.772 |
| 26.12.2020 | 1.27 | 1.54 | 0.936 |
| 25.12.2020 | 1.41 | 1.54 | 1.22 |
© Bayerisches Landesamt für Umwelt 2024