
- Start >
- Rivers >
- Discharge >
- Regnitz >
- Kreppendorf >
- Chart of total period

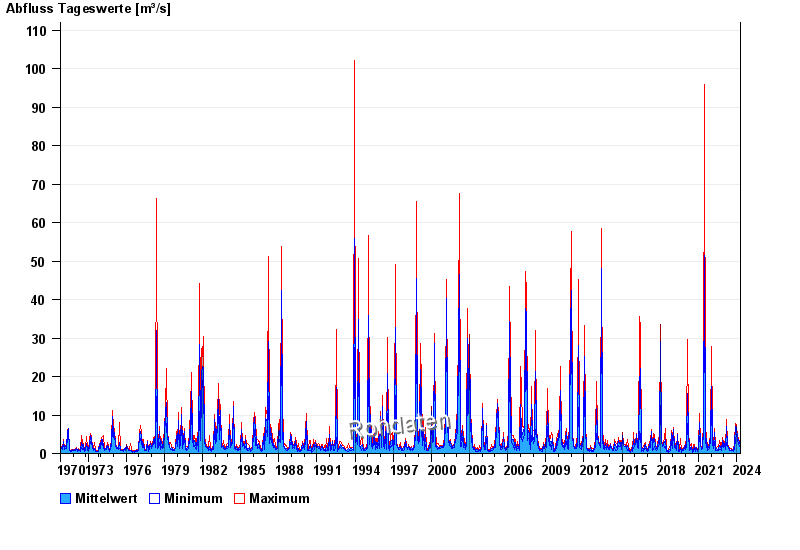
Chart of total period Kreppendorf / Zenn
Discharge from 01.11.1970 to 26.04.2024
| Date | Mean value [m³/s] | Maximum [m³/s] | Minimum [m³/s] |
|---|---|---|---|
| 26.04.2024 | 1.4 | 1.43 | 1.36 |
| 25.04.2024 | 1.39 | 1.47 | 1.32 |
| 24.04.2024 | 1.36 | 1.43 | 1.24 |
| 23.04.2024 | 1.49 | 1.59 | 1.39 |
| 22.04.2024 | 1.82 | 1.96 | 1.55 |
| 21.04.2024 | 1.61 | 1.83 | 1.51 |
| 20.04.2024 | 1.85 | 2.09 | 1.63 |
© Bayerisches Landesamt für Umwelt 2024