

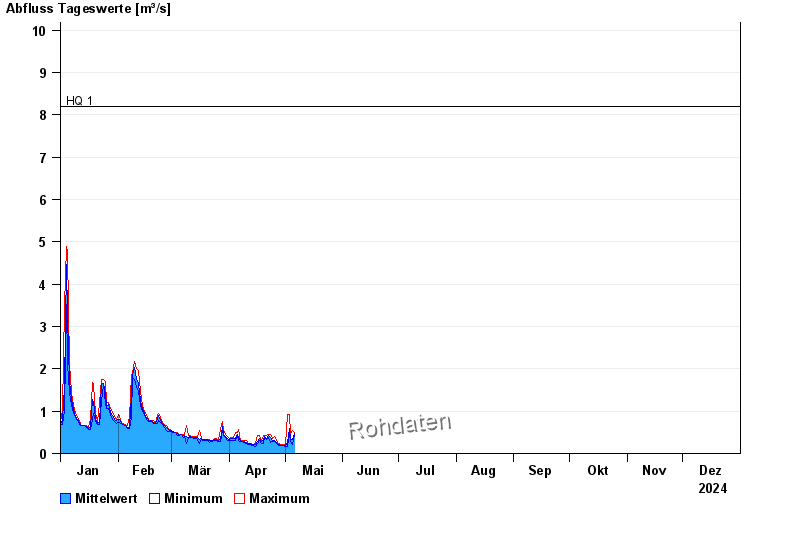
Chart of year Illesheim / Aisch
Discharge from 01.01.2024 to 31.12.2024
note
Wasserstand und Abfluss wird zeitweise durch Biberdamm beeinflusst.
- HQ1 8,2 m³/s
- HQ2 10,5 m³/s
- HQ5 13 m³/s
- HQ10 16 m³/s
- HQ20 20 m³/s
- HQ50 27 m³/s
- HQ100 32 m³/s
| Date | Mean value [m³/s] | Maximum [m³/s] | Minimum [m³/s] |
|---|---|---|---|
| 26.04.2024 | 0.275 | 0.299 | 0.264 |
| 25.04.2024 | 0.301 | 0.395 | 0.281 |
| 24.04.2024 | 0.307 | 0.356 | 0.281 |
| 23.04.2024 | 0.376 | 0.438 | 0.264 |
| 22.04.2024 | 0.414 | 0.46 | 0.375 |
| 21.04.2024 | 0.364 | 0.416 | 0.336 |
| 20.04.2024 | 0.403 | 0.416 | 0.375 |
© Bayerisches Landesamt für Umwelt 2024