

Chart of year Illesheim / Aisch
Discharge from 27.10.2019 to 26.10.2020
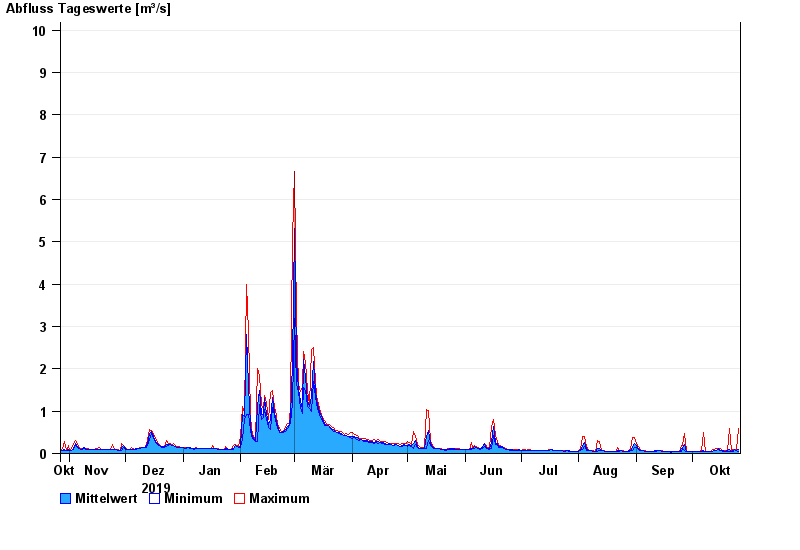
note
Wasserstand und Abfluss wird zeitweise durch Biberdamm beeinflusst.
- 09.07.2021 Abfluss: 60,6 m³/s
- 09.12.2010 Abfluss: 27,5 m³/s
- 01.06.2013 Abfluss: 24,2 m³/s
- 30.05.2016 Abfluss: 23,4 m³/s
- 21.12.1993 Abfluss: 22 m³/s
| Date | Mean value [m³/s] | Maximum [m³/s] | Minimum [m³/s] |
|---|---|---|---|
| 26.10.2020 | 0.104 | 0.59 | 0.047 |
| 25.10.2020 | 0.077 | 0.088 | 0.076 |
| 24.10.2020 | 0.096 | 0.104 | 0.088 |
| 23.10.2020 | 0.069 | 0.104 | 0.058 |
| 22.10.2020 | 0.056 | 0.067 | 0.045 |
| 21.10.2020 | 0.089 | 0.583 | 0.045 |
| 20.10.2020 | 0.062 | 0.07 | 0.056 |
© Bayerisches Landesamt für Umwelt 2024