

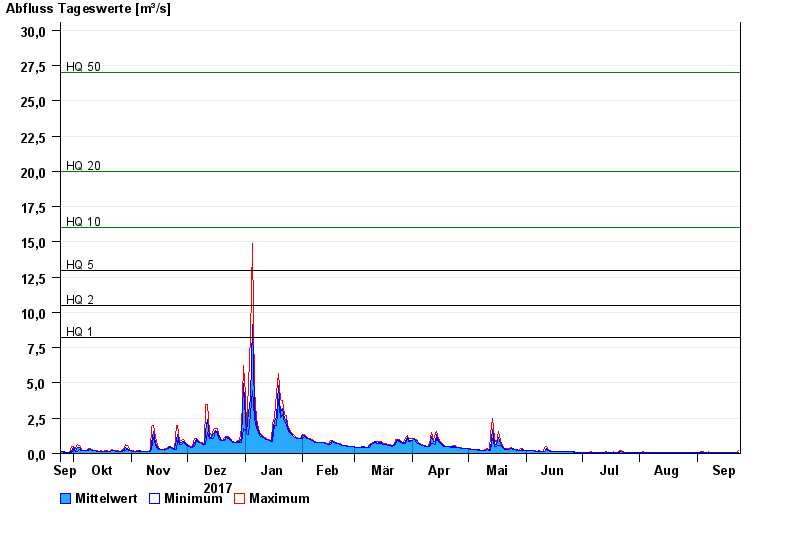
Chart of year Illesheim / Aisch
Discharge from 24.09.2017 to 23.09.2018
note
Wasserstand und Abfluss wird zeitweise durch Biberdamm beeinflusst.
- HQ1 8,2 m³/s
- HQ2 10,5 m³/s
- HQ5 13 m³/s
- HQ10 16 m³/s
- HQ20 20 m³/s
- HQ50 27 m³/s
- HQ100 32 m³/s
| Date | Mean value [m³/s] | Maximum [m³/s] | Minimum [m³/s] |
|---|---|---|---|
| 23.09.2018 | 0.089 | 0.197 | 0.055 |
| 22.09.2018 | 0.049 | 0.065 | 0.046 |
| 21.09.2018 | 0.05 | 0.053 | 0.046 |
| 20.09.2018 | 0.053 | 0.054 | 0.053 |
| 19.09.2018 | 0.054 | 0.055 | 0.054 |
| 18.09.2018 | 0.055 | 0.056 | 0.055 |
| 17.09.2018 | 0.057 | 0.057 | 0.056 |
© Bayerisches Landesamt für Umwelt 2024