

Chart of year Illesheim / Aisch
Discharge from 22.11.2019 to 21.11.2020
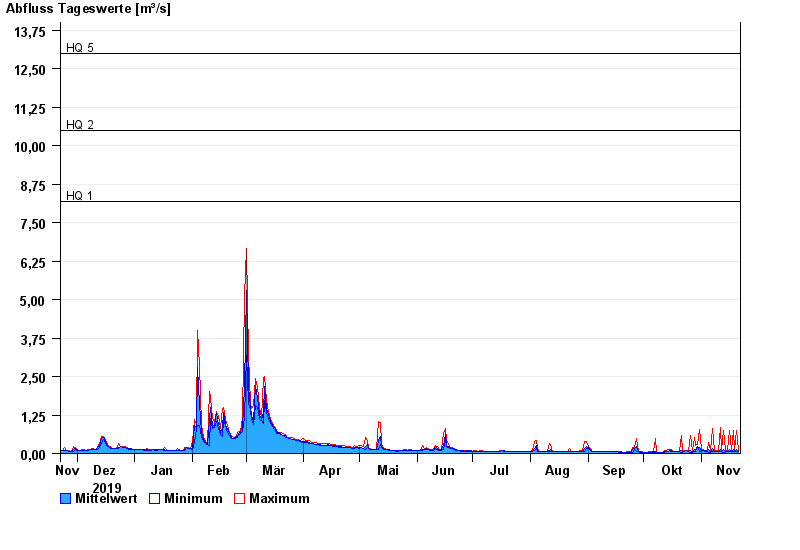
note
Wasserstand und Abfluss wird zeitweise durch Biberdamm beeinflusst.
- HQ1 8,2 m³/s
- HQ2 10,5 m³/s
- HQ5 13 m³/s
- HQ10 16 m³/s
- HQ20 20 m³/s
- HQ50 27 m³/s
- HQ100 32 m³/s
| Date | Mean value [m³/s] | Maximum [m³/s] | Minimum [m³/s] |
|---|---|---|---|
| 21.11.2020 | 0.063 | 0.082 | 0.053 |
| 20.11.2020 | 0.127 | 0.748 | 0.053 |
| 19.11.2020 | 0.061 | 0.098 | 0.049 |
| 18.11.2020 | 0.123 | 0.744 | 0.049 |
| 17.11.2020 | 0.065 | 0.088 | 0.054 |
| 16.11.2020 | 0.124 | 0.751 | 0.054 |
| 15.11.2020 | 0.073 | 0.083 | 0.067 |
© Bayerisches Landesamt für Umwelt 2024