

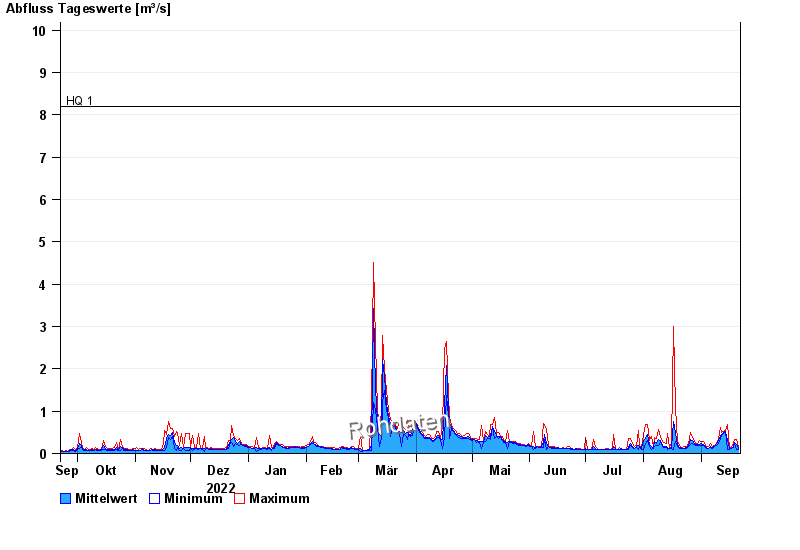
Chart of year Illesheim / Aisch
Discharge from 22.09.2022 to 21.09.2023
note
Wasserstand und Abfluss wird zeitweise durch Biberdamm beeinflusst.
- HQ1 8,2 m³/s
- HQ2 10,5 m³/s
- HQ5 13 m³/s
- HQ10 16 m³/s
- HQ20 20 m³/s
- HQ50 27 m³/s
- HQ100 32 m³/s
| Date | Mean value [m³/s] | Maximum [m³/s] | Minimum [m³/s] |
|---|---|---|---|
| 21.09.2023 | 0.112 | 0.14 | 0.105 |
| 20.09.2023 | 0.215 | 0.324 | 0.094 |
| 19.09.2023 | 0.261 | 0.324 | 0.248 |
| 18.09.2023 | 0.175 | 0.248 | 0.14 |
| 17.09.2023 | 0.117 | 0.14 | 0.116 |
| 16.09.2023 | 0.113 | 0.14 | 0.105 |
| 15.09.2023 | 0.317 | 0.693 | 0.105 |
© Bayerisches Landesamt für Umwelt 2024