

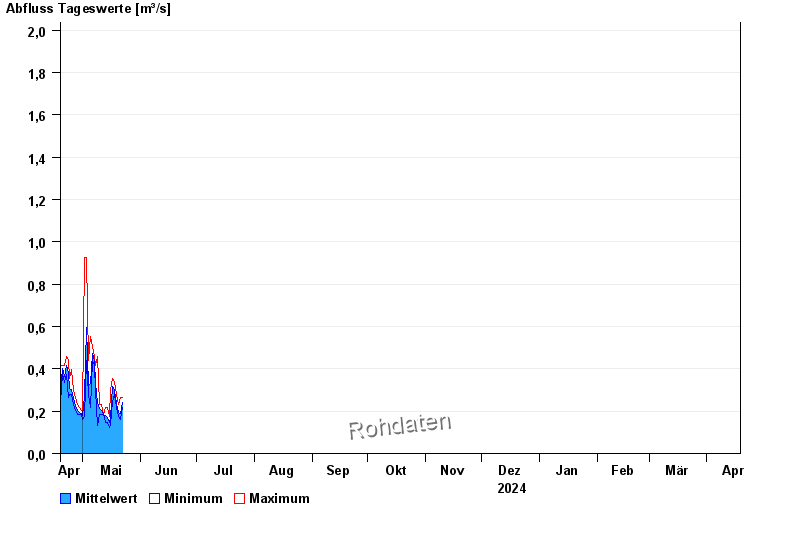
Chart of year Illesheim / Aisch
Discharge from 19.04.2024 to 18.04.2025
note
Wasserstand und Abfluss wird zeitweise durch Biberdamm beeinflusst.
- HQ1 8,2 m³/s
- HQ2 10,5 m³/s
- HQ5 13 m³/s
- HQ10 16 m³/s
- HQ20 20 m³/s
- HQ50 27 m³/s
- HQ100 32 m³/s
| Date | Mean value [m³/s] | Maximum [m³/s] | Minimum [m³/s] |
|---|---|---|---|
| 01.05.2024 | 0.177 | 0.201 | 0.159 |
| 30.04.2024 | 0.189 | 0.201 | 0.186 |
| 29.04.2024 | 0.196 | 0.216 | 0.186 |
| 28.04.2024 | 0.204 | 0.231 | 0.186 |
| 27.04.2024 | 0.229 | 0.264 | 0.201 |
| 26.04.2024 | 0.258 | 0.299 | 0.231 |
| 25.04.2024 | 0.301 | 0.395 | 0.281 |
© Bayerisches Landesamt für Umwelt 2024