

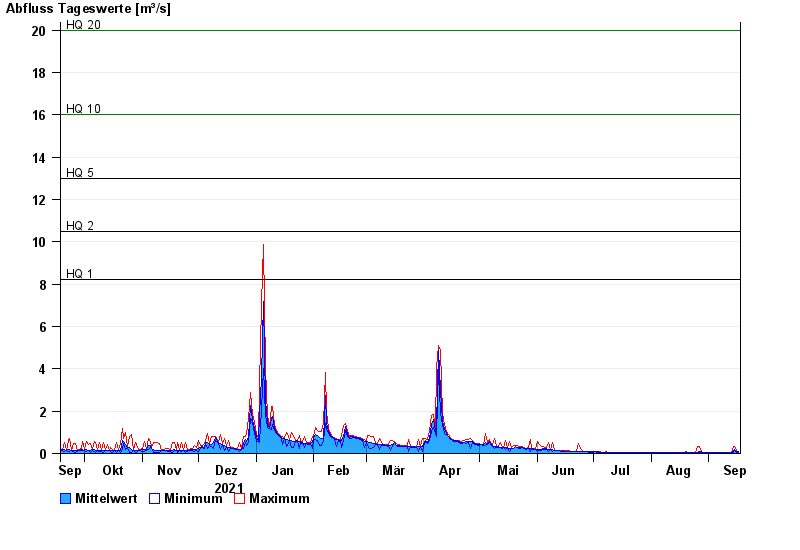
Chart of year Illesheim / Aisch
Discharge from 18.09.2021 to 17.09.2022
note
Wasserstand und Abfluss wird zeitweise durch Biberdamm beeinflusst.
- HQ1 8,2 m³/s
- HQ2 10,5 m³/s
- HQ5 13 m³/s
- HQ10 16 m³/s
- HQ20 20 m³/s
- HQ50 27 m³/s
- HQ100 32 m³/s
| Date | Mean value [m³/s] | Maximum [m³/s] | Minimum [m³/s] |
|---|---|---|---|
| 17.09.2022 | 0.076 | 0.091 | 0.07 |
| 16.09.2022 | 0.09 | 0.128 | 0.07 |
| 15.09.2022 | 0.211 | 0.335 | 0.128 |
| 14.09.2022 | 0.123 | 0.335 | 0.047 |
| 13.09.2022 | 0.047 | 0.056 | 0.041 |
| 12.09.2022 | 0.046 | 0.06 | 0.041 |
| 11.09.2022 | 0.059 | 0.063 | 0.053 |
© Bayerisches Landesamt für Umwelt 2024