
- Start >
- Rivers >
- Discharge >
- Regnitz >
- Hohenstadt >
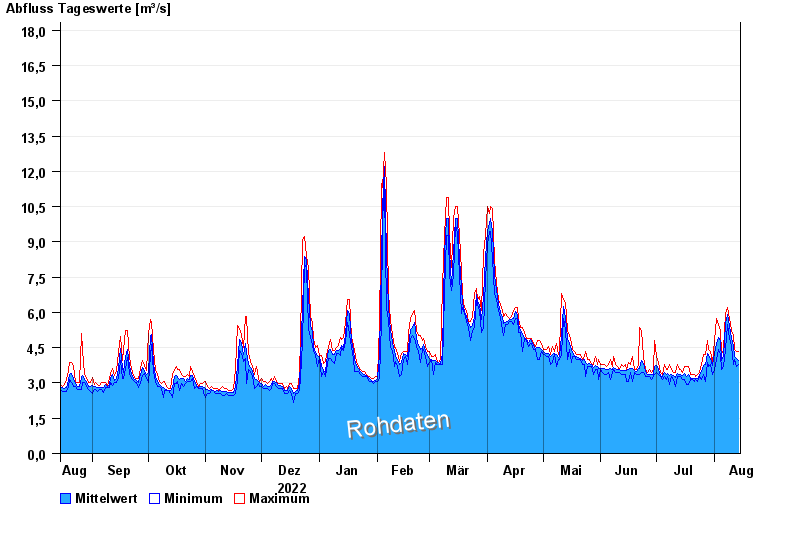
- Chart of year

Chart of year Hohenstadt / Pegnitz
Discharge from 15.08.2022 to 14.08.2023
- 05.02.1909 Abfluss: 172 m³/s
- 14.01.2011 Abfluss: 72,9 m³/s
- 06.03.1947 Abfluss: 59 m³/s
- 23.02.1970 Abfluss: 52,7 m³/s
- 10.11.1927 Abfluss: 51 m³/s
| Date | Mean value [m³/s] | Maximum [m³/s] | Minimum [m³/s] |
|---|---|---|---|
| 14.08.2023 | 3.97 | 4.33 | 3.79 |
| 13.08.2023 | 4.04 | 4.33 | 3.68 |
| 12.08.2023 | 4.13 | 4.44 | 4 |
| 11.08.2023 | 4.58 | 5.02 | 3.79 |
| 10.08.2023 | 4.88 | 5.25 | 4.56 |
| 09.08.2023 | 5.46 | 5.72 | 4.9 |
| 08.08.2023 | 5.93 | 6.19 | 5.48 |
© Bayerisches Landesamt für Umwelt 2024