
- Start >
- Rivers >
- Discharge >
- Regnitz >
- Hohenstadt >
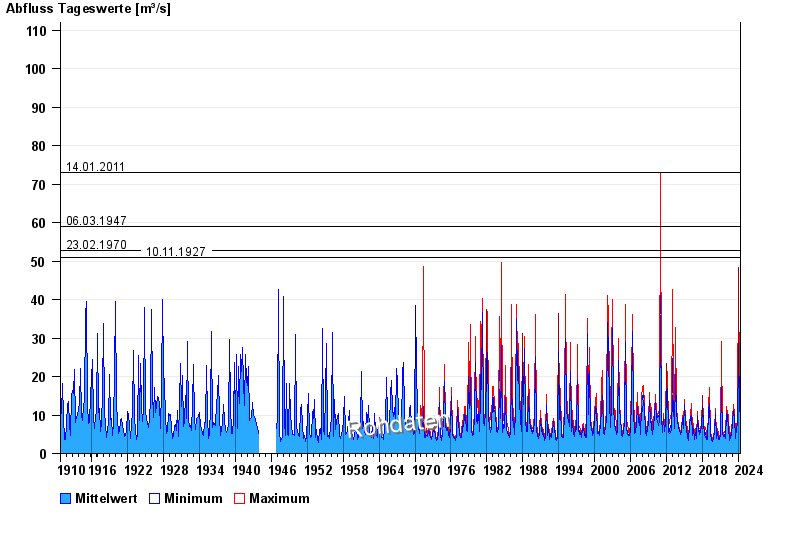
- Chart of total period

Chart of total period Hohenstadt / Pegnitz
Discharge from 01.11.1910 to 28.04.2024
- 05.02.1909 Abfluss: 172 m³/s
- 14.01.2011 Abfluss: 72,9 m³/s
- 06.03.1947 Abfluss: 59 m³/s
- 23.02.1970 Abfluss: 52,7 m³/s
- 10.11.1927 Abfluss: 51 m³/s
| Date | Mean value [m³/s] | Maximum [m³/s] | Minimum [m³/s] |
|---|---|---|---|
| 28.04.2024 | 5.48 | 5.54 | 5.44 |
| 27.04.2024 | 5.68 | 5.85 | 5.54 |
| 26.04.2024 | 5.88 | 6.05 | 5.74 |
| 25.04.2024 | 6.07 | 6.16 | 5.95 |
| 24.04.2024 | 6.35 | 6.77 | 6.16 |
| 23.04.2024 | 7.3 | 8.12 | 6.46 |
| 22.04.2024 | 7.83 | 8.44 | 7.29 |
© Bayerisches Landesamt für Umwelt 2024