
- Start >
- Rivers >
- Discharge >
- Regnitz >
- Hallerndorf >
- Chart of year

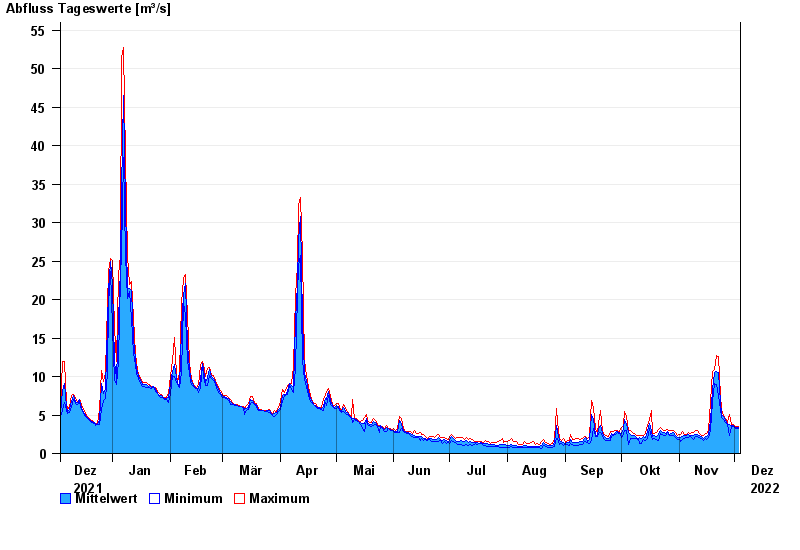
Chart of year Hallerndorf / Aisch
Discharge from 04.12.2021 to 03.12.2022
| Date | Mean value [m³/s] | Maximum [m³/s] | Minimum [m³/s] |
|---|---|---|---|
| 03.12.2022 | 3.42 | 3.52 | 3.28 |
| 02.12.2022 | 3.4 | 3.52 | 3.27 |
| 01.12.2022 | 3.47 | 3.52 | 3.39 |
| 30.11.2022 | 3.69 | 3.76 | 3.51 |
| 29.11.2022 | 3.63 | 3.76 | 3.51 |
| 28.11.2022 | 3.81 | 5.13 | 2.38 |
| 27.11.2022 | 3.9 | 4.02 | 3.76 |
© Bayerisches Landesamt für Umwelt 2024