
- Start >
- Rivers >
- Discharge >
- Regnitz >
- Hallerndorf >
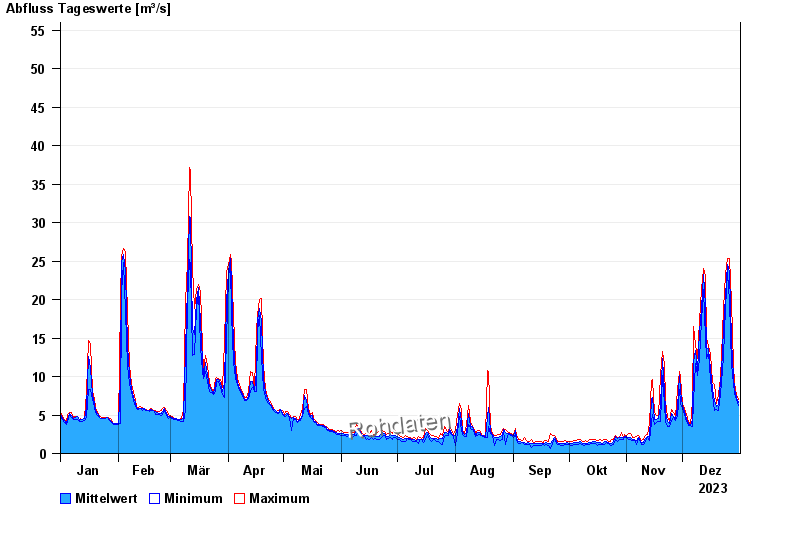
- Chart of year

Chart of year Hallerndorf / Aisch
Discharge from 01.01.2023 to 31.12.2023
- 10.07.2021 Abfluss: 226 m³/s
- 02.06.2013 Abfluss: 189 m³/s
- 09.01.2011 Abfluss: 174 m³/s
- 10.12.2010 Abfluss: 148 m³/s
- 06.01.2018 Abfluss: 77,4 m³/s
| Date | Mean value [m³/s] | Maximum [m³/s] | Minimum [m³/s] |
|---|---|---|---|
| 31.12.2023 | 6.58 | 7.02 | 6.2 |
| 30.12.2023 | 7.25 | 7.68 | 7.02 |
| 29.12.2023 | 8.4 | 9.07 | 7.86 |
| 28.12.2023 | 9.93 | 11.5 | 9.07 |
| 27.12.2023 | 14.7 | 19.8 | 11.5 |
| 26.12.2023 | 23.7 | 25.4 | 19.8 |
| 25.12.2023 | 24.6 | 25.4 | 23.5 |
© Bayerisches Landesamt für Umwelt 2024