
- Start >
- Rivers >
- Discharge >
- Regnitz >
- Gerolfingen >
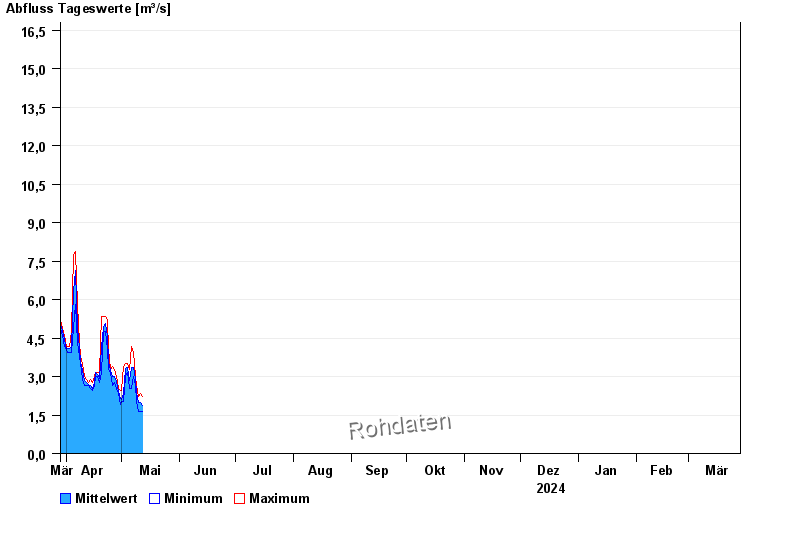
- Chart of year

Chart of year Gerolfingen / Wörnitz
Discharge from 29.03.2024 to 28.03.2025
- HQ1 69 m³/s
- HQ2 90 m³/s
- HQ5 120 m³/s
- HQ10 150 m³/s
- HQ20 175 m³/s
- HQ50 210 m³/s
- HQ100 235 m³/s
| Date | Mean value [m³/s] | Maximum [m³/s] | Minimum [m³/s] |
|---|---|---|---|
| 14.05.2024 | 1.54 | 1.64 | 1.47 |
| 13.05.2024 | 1.69 | 2.01 | 1.31 |
| 12.05.2024 | 1.87 | 2.22 | 1.64 |
| 11.05.2024 | 2 | 2.33 | 1.64 |
| 10.05.2024 | 1.99 | 2.22 | 1.64 |
| 09.05.2024 | 2.39 | 2.66 | 2.01 |
| 08.05.2024 | 2.89 | 3.02 | 2.66 |
© Bayerisches Landesamt für Umwelt 2024