
- Start >
- Rivers >
- Discharge >
- Regnitz >
- Frauenkreuz >
- Chart of year

Chart of year Frauenkreuz / Gründlach
Discharge from 01.01.2023 to 31.12.2023
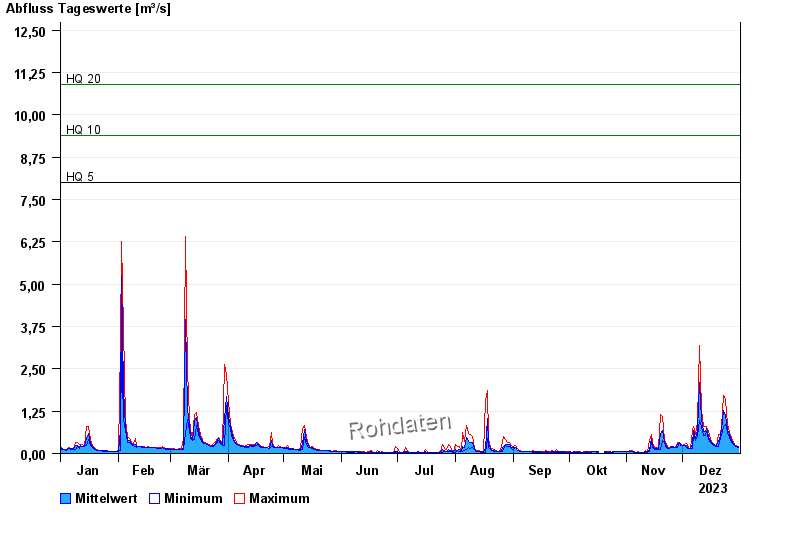
- HQ5 8 m³/s
- HQ10 9,4 m³/s
- HQ20 10,9 m³/s
- HQ100 14,3 m³/s
| Date | Mean value [m³/s] | Maximum [m³/s] | Minimum [m³/s] |
|---|---|---|---|
| 31.12.2023 | 0.196 | 0.212 | 0.186 |
| 30.12.2023 | 0.218 | 0.226 | 0.199 |
| 29.12.2023 | 0.249 | 0.269 | 0.239 |
| 28.12.2023 | 0.294 | 0.317 | 0.269 |
| 27.12.2023 | 0.394 | 0.482 | 0.317 |
| 26.12.2023 | 0.565 | 0.623 | 0.458 |
| 25.12.2023 | 0.715 | 0.85 | 0.623 |
© Bayerisches Landesamt für Umwelt 2024