

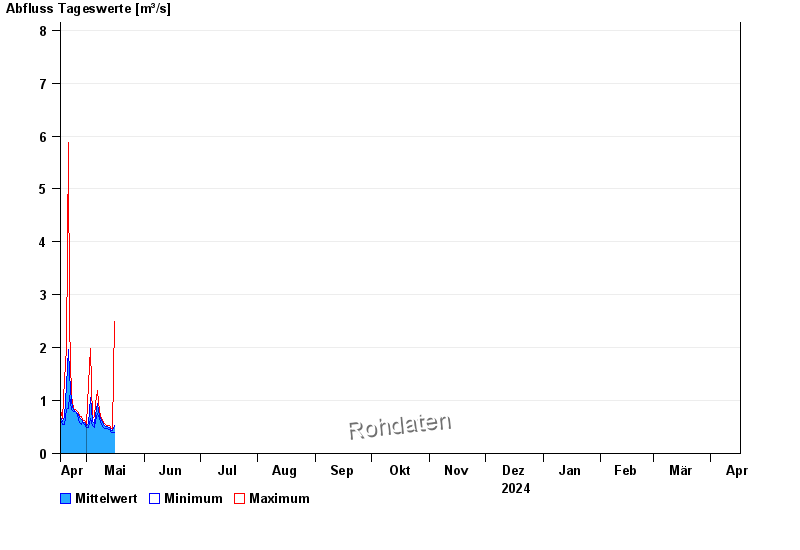
Chart of year Erlangen / Schwabach
Discharge from 17.04.2024 to 16.04.2025
- 29.07.1941 Abfluss: 105 m³/s
- 26.01.1995 Abfluss: 60,3 m³/s
- 11.07.1954 Abfluss: 56,7 m³/s
- 24.07.1940 Abfluss: 50,8 m³/s
- 03.03.1956 Abfluss: 49,1 m³/s
| Date | Mean value [m³/s] | Maximum [m³/s] | Minimum [m³/s] |
|---|---|---|---|
| 29.04.2024 | 0.609 | 0.624 | 0.59 |
| 28.04.2024 | 0.636 | 0.691 | 0.557 |
| 27.04.2024 | 0.676 | 0.725 | 0.59 |
| 26.04.2024 | 0.754 | 0.792 | 0.725 |
| 25.04.2024 | 0.799 | 0.825 | 0.792 |
| 24.04.2024 | 0.829 | 0.859 | 0.792 |
| 23.04.2024 | 0.962 | 1.09 | 0.825 |
© Bayerisches Landesamt für Umwelt 2024