

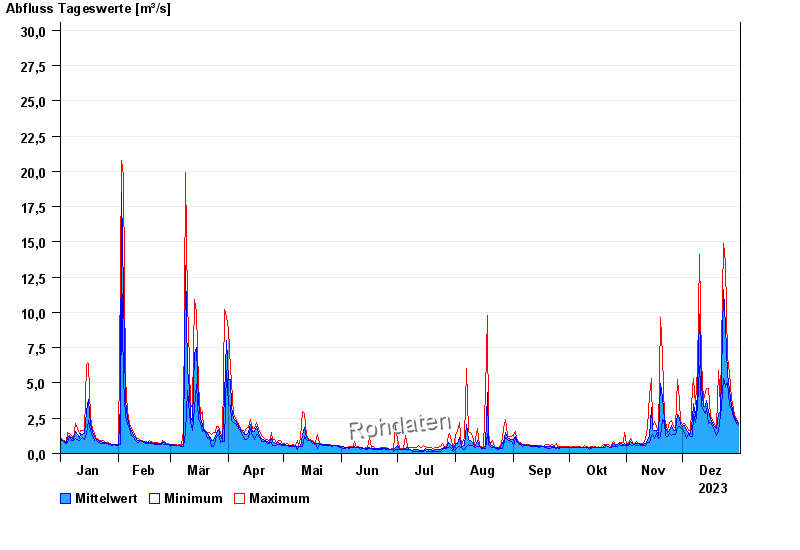
Chart of year Erlangen / Schwabach
Discharge from 01.01.2023 to 31.12.2023
- 29.07.1941 Abfluss: 105 m³/s
- 26.01.1995 Abfluss: 60,3 m³/s
- 11.07.1954 Abfluss: 56,7 m³/s
- 24.07.1940 Abfluss: 50,8 m³/s
- 03.03.1956 Abfluss: 49,1 m³/s
| Date | Mean value [m³/s] | Maximum [m³/s] | Minimum [m³/s] |
|---|---|---|---|
| 31.12.2023 | 2.14 | 2.21 | 1.99 |
| 30.12.2023 | 2.31 | 2.42 | 2.14 |
| 29.12.2023 | 2.54 | 2.71 | 2.42 |
| 28.12.2023 | 2.9 | 3.18 | 2.56 |
| 27.12.2023 | 3.43 | 3.91 | 3.1 |
| 26.12.2023 | 4.48 | 5.77 | 3.5 |
| 25.12.2023 | 5.68 | 6.82 | 5.03 |
© Bayerisches Landesamt für Umwelt 2024