

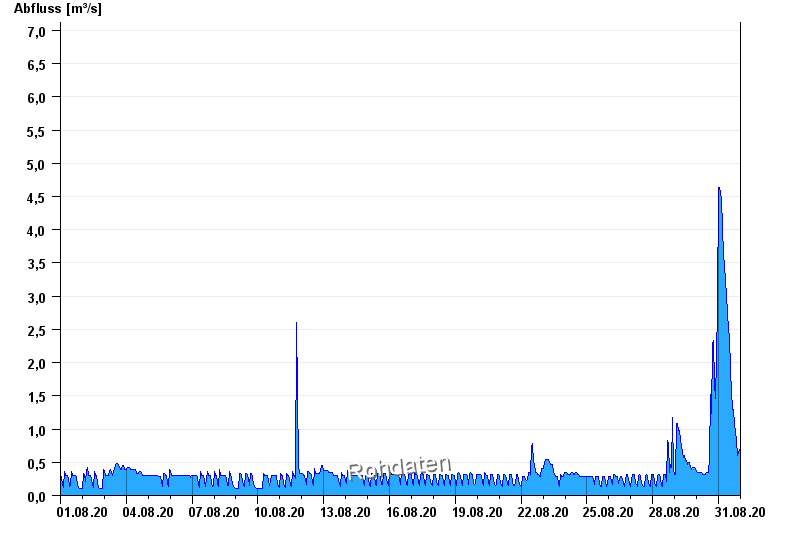
Chart of month Erlangen / Schwabach
Discharge from 01.08.2020 to 31.08.2020
- 29.07.1941 Abfluss: 105 m³/s
- 26.01.1995 Abfluss: 60,3 m³/s
- 11.07.1954 Abfluss: 56,7 m³/s
- 24.07.1940 Abfluss: 50,8 m³/s
- 03.03.1956 Abfluss: 49,1 m³/s
| Date | Runoff [m³/s] |
|---|---|
| 01.09.2020 00:45 | 0.688 |
| 01.09.2020 00:30 | 0.688 |
| 01.09.2020 00:15 | 0.688 |
| 01.09.2020 00:00 | 0.688 |
| 31.08.2020 23:45 | 0.688 |
| 31.08.2020 23:30 | 0.688 |
| 31.08.2020 23:15 | 0.688 |
© Bayerisches Landesamt für Umwelt 2024