
- Start >
- Rivers >
- Discharge >
- Regnitz >
- Emskirchen >
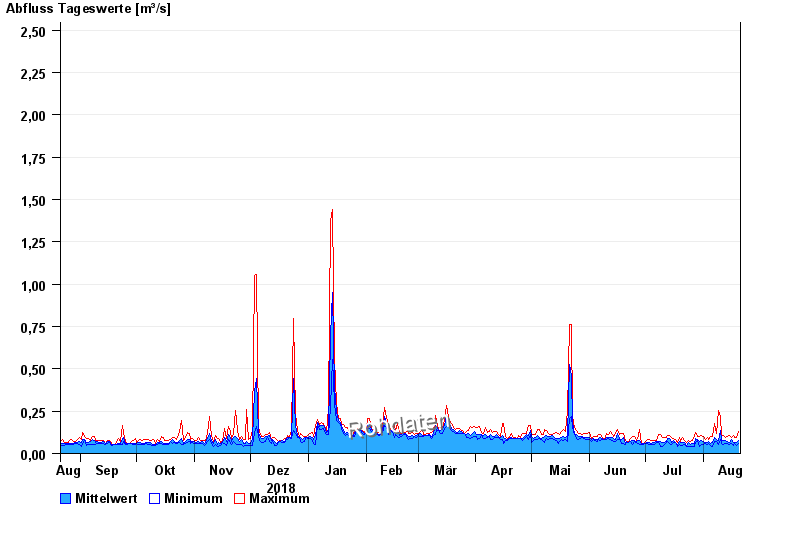
- Chart of year

Chart of year Emskirchen / Aurach
Discharge from 21.08.2018 to 20.08.2019
note
Wasserstand und Abfluss wird zeitweise durch Biberdamm beeinflusst.
- HQ1 3,9 m³/s
- HQ2 6,6 m³/s
- HQ5 9,2 m³/s
- HQ10 13,4 m³/s
- HQ20 18,7 m³/s
- HQ50 28,9 m³/s
- HQ100 39,6 m³/s
| Date | Mean value [m³/s] | Maximum [m³/s] | Minimum [m³/s] |
|---|---|---|---|
| 20.08.2019 | 0.075 | 0.129 | 0.058 |
| 19.08.2019 | 0.067 | 0.094 | 0.048 |
| 18.08.2019 | 0.064 | 0.094 | 0.058 |
| 17.08.2019 | 0.066 | 0.108 | 0.045 |
| 16.08.2019 | 0.081 | 0.094 | 0.061 |
| 15.08.2019 | 0.067 | 0.108 | 0.054 |
| 14.08.2019 | 0.07 | 0.098 | 0.057 |
© Bayerisches Landesamt für Umwelt 2024