
- Start >
- Rivers >
- Discharge >
- Regnitz >
- Emskirchen >
- Chart of year

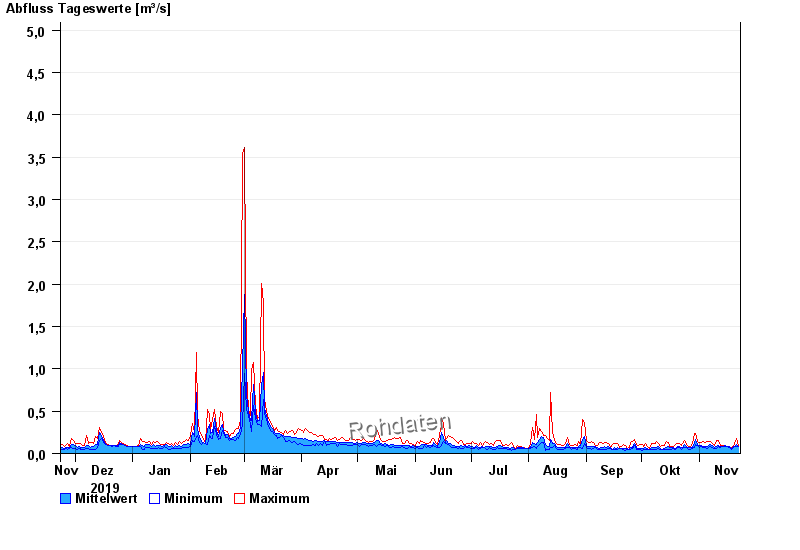
Chart of year Emskirchen / Aurach
Discharge from 23.11.2019 to 22.11.2020
note
Wasserstand und Abfluss wird zeitweise durch Biberdamm beeinflusst.
- 21.12.1993 Abfluss: 27,7 m³/s
- 26.01.1995 Abfluss: 26,5 m³/s
- 21.03.2002 Abfluss: 26,2 m³/s
- 29.05.2007 Abfluss: 16,6 m³/s
- 02.03.1987 Abfluss: 15,4 m³/s
| Date | Mean value [m³/s] | Maximum [m³/s] | Minimum [m³/s] |
|---|---|---|---|
| 22.11.2020 | 0.084 | 0.099 | 0.08 |
| 21.11.2020 | 0.105 | 0.179 | 0.085 |
| 20.11.2020 | 0.085 | 0.113 | 0.08 |
| 19.11.2020 | 0.078 | 0.08 | 0.071 |
| 18.11.2020 | 0.059 | 0.075 | 0.053 |
| 17.11.2020 | 0.08 | 0.087 | 0.075 |
| 16.11.2020 | 0.082 | 0.083 | 0.079 |
© Bayerisches Landesamt für Umwelt 2024