
- Start >
- Rivers >
- Discharge >
- Regnitz >
- Emskirchen >
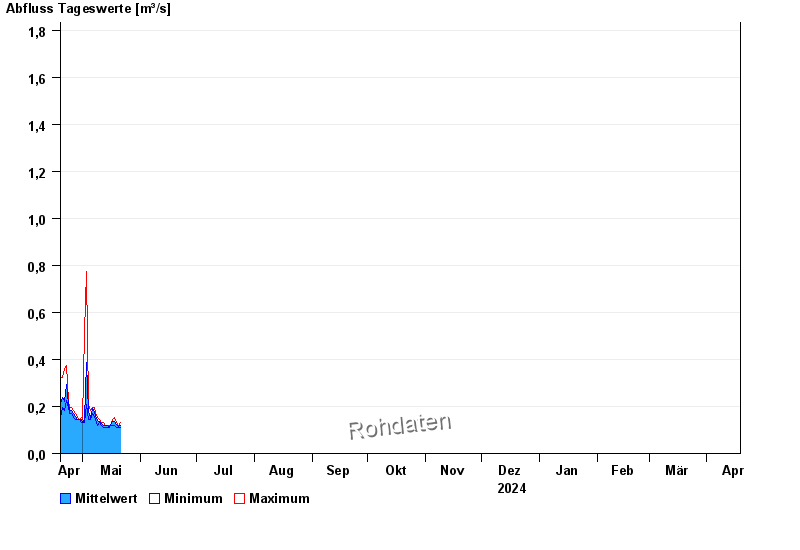
- Chart of year

Chart of year Emskirchen / Mittlere Aurach
Discharge from 19.04.2024 to 18.04.2025
note
Wasserstand und Abfluss wird zeitweise durch Biberdamm beeinflusst.
- HQ1 3,9 m³/s
- HQ2 6,6 m³/s
- HQ5 9,2 m³/s
- HQ10 13,4 m³/s
- HQ20 18,7 m³/s
- HQ50 28,9 m³/s
- HQ100 39,6 m³/s
| Date | Mean value [m³/s] | Maximum [m³/s] | Minimum [m³/s] |
|---|---|---|---|
| 06.06.2024 | 0.192 | 0.196 | 0.155 |
| 05.06.2024 | 0.222 | 0.257 | 0.196 |
| 04.06.2024 | 0.308 | 0.392 | 0.257 |
| 03.06.2024 | 0.529 | 0.7 | 0.392 |
| 02.06.2024 | 1.39 | 2.23 | 0.681 |
| 01.06.2024 | 0.796 | 2.32 | 0.241 |
| 31.05.2024 | 0.146 | 0.225 | 0.13 |
© Bayerisches Landesamt für Umwelt 2024