

Chart of year Büg / Schwabach
Discharge from 21.08.2018 to 20.08.2019
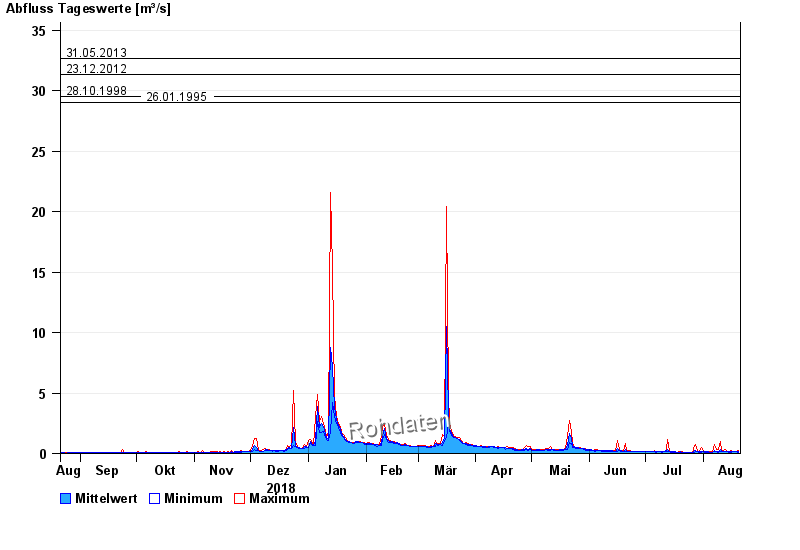
- 20.07.2011 Abfluss: 48,5 m³/s
- 31.05.2013 Abfluss: 32,7 m³/s
- 23.12.2012 Abfluss: 31,3 m³/s
- 28.10.1998 Abfluss: 29,5 m³/s
- 26.01.1995 Abfluss: 29 m³/s
| Date | Mean value [m³/s] | Maximum [m³/s] | Minimum [m³/s] |
|---|---|---|---|
| 20.08.2019 | 0.143 | 0.209 | 0.108 |
| 19.08.2019 | 0.139 | 0.157 | 0.135 |
| 18.08.2019 | 0.141 | 0.145 | 0.125 |
| 17.08.2019 | 0.145 | 0.145 | 0.135 |
| 16.08.2019 | 0.177 | 0.256 | 0.107 |
| 15.08.2019 | 0.147 | 0.193 | 0.099 |
| 14.08.2019 | 0.145 | 0.155 | 0.144 |
© Bayerisches Landesamt für Umwelt 2024