

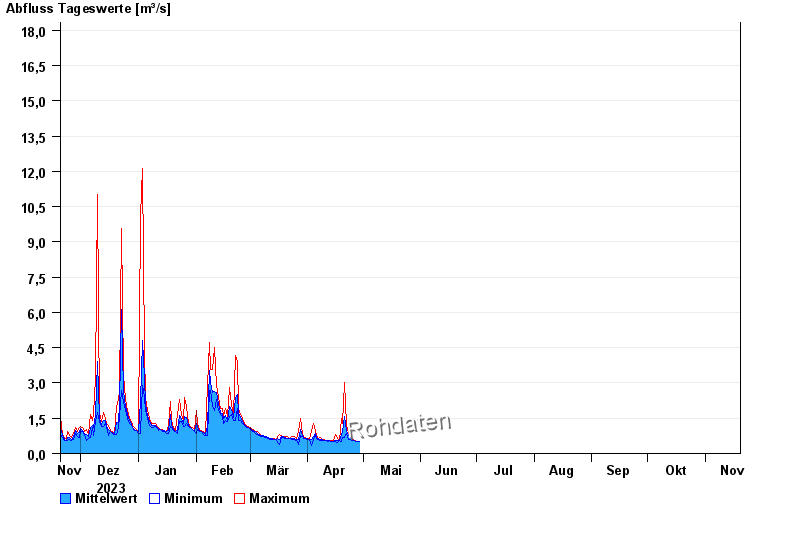
Chart of year Büg / Schwabach
Discharge from 20.11.2023 to 19.11.2024
- 20.07.2011 Abfluss: 48,5 m³/s
- 31.05.2013 Abfluss: 32,7 m³/s
- 23.12.2012 Abfluss: 31,3 m³/s
- 28.10.1998 Abfluss: 29,5 m³/s
- 26.01.1995 Abfluss: 29 m³/s
| Date | Mean value [m³/s] | Maximum [m³/s] | Minimum [m³/s] |
|---|---|---|---|
| 16.05.2024 | 0.397 | 0.422 | 0.397 |
| 15.05.2024 | 0.398 | 0.422 | 0.397 |
| 14.05.2024 | 0.416 | 0.422 | 0.397 |
| 13.05.2024 | 0.422 | 0.422 | 0.422 |
| 12.05.2024 | 0.441 | 0.449 | 0.422 |
| 11.05.2024 | 0.455 | 0.477 | 0.422 |
| 10.05.2024 | 0.47 | 0.477 | 0.449 |
© Bayerisches Landesamt für Umwelt 2024