

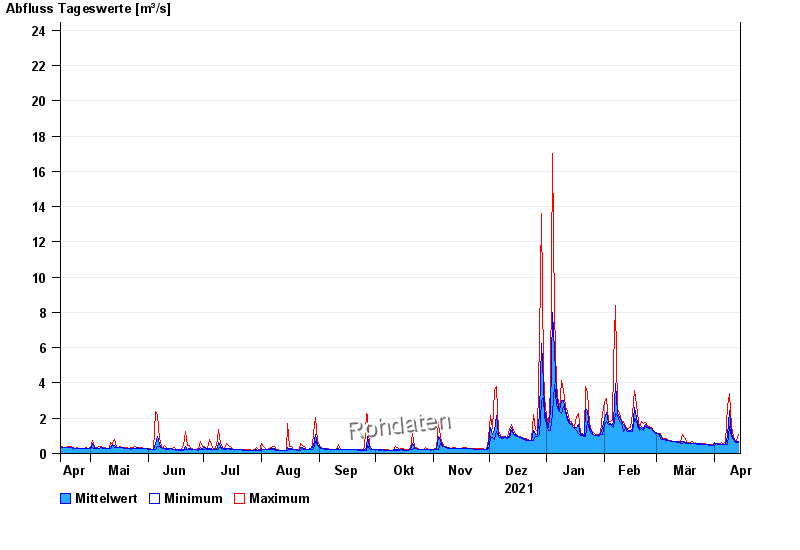
Chart of year Büg / Schwabach
Discharge from 15.04.2021 to 14.04.2022
- 20.07.2011 Abfluss: 48,5 m³/s
- 31.05.2013 Abfluss: 32,7 m³/s
- 23.12.2012 Abfluss: 31,3 m³/s
- 28.10.1998 Abfluss: 29,5 m³/s
- 26.01.1995 Abfluss: 29 m³/s
| Date | Mean value [m³/s] | Maximum [m³/s] | Minimum [m³/s] |
|---|---|---|---|
| 14.04.2022 | 0.697 | 1.07 | 0.65 |
| 13.04.2022 | 0.698 | 0.728 | 0.65 |
| 12.04.2022 | 0.745 | 0.769 | 0.688 |
| 11.04.2022 | 0.86 | 0.964 | 0.769 |
| 10.04.2022 | 1.16 | 1.53 | 0.964 |
| 09.04.2022 | 2.45 | 3.4 | 1.54 |
| 08.04.2022 | 0.995 | 2.65 | 0.519 |
© Bayerisches Landesamt für Umwelt 2024