

Chart of year Büg / Schwabach
Discharge from 27.10.2021 to 26.10.2022
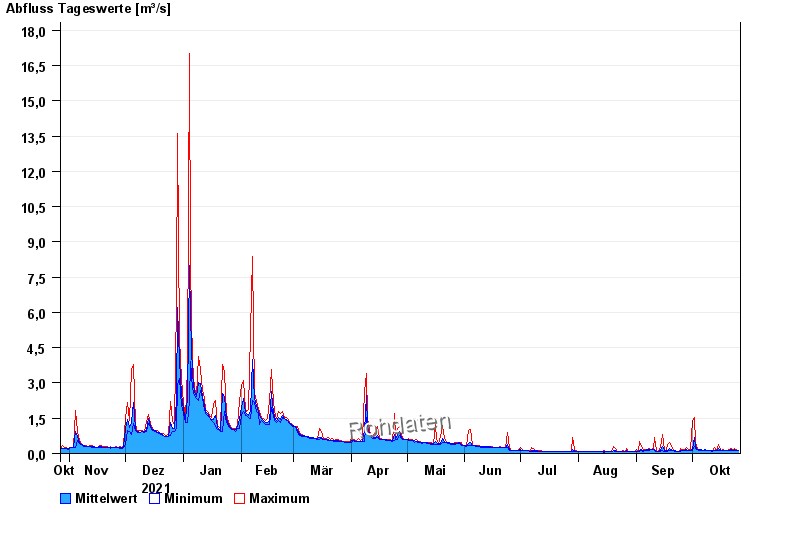
| Date | Mean value [m³/s] | Maximum [m³/s] | Minimum [m³/s] |
|---|---|---|---|
| 26.10.2022 | 0.134 | 0.134 | 0.134 |
| 25.10.2022 | 0.147 | 0.157 | 0.134 |
| 24.10.2022 | 0.15 | 0.214 | 0.114 |
| 23.10.2022 | 0.133 | 0.134 | 0.124 |
| 22.10.2022 | 0.159 | 0.232 | 0.134 |
| 21.10.2022 | 0.138 | 0.157 | 0.134 |
| 20.10.2022 | 0.136 | 0.145 | 0.134 |
© Bayerisches Landesamt für Umwelt 2024