

Chart of year Büg / Schwabach
Discharge from 19.02.2022 to 18.02.2023
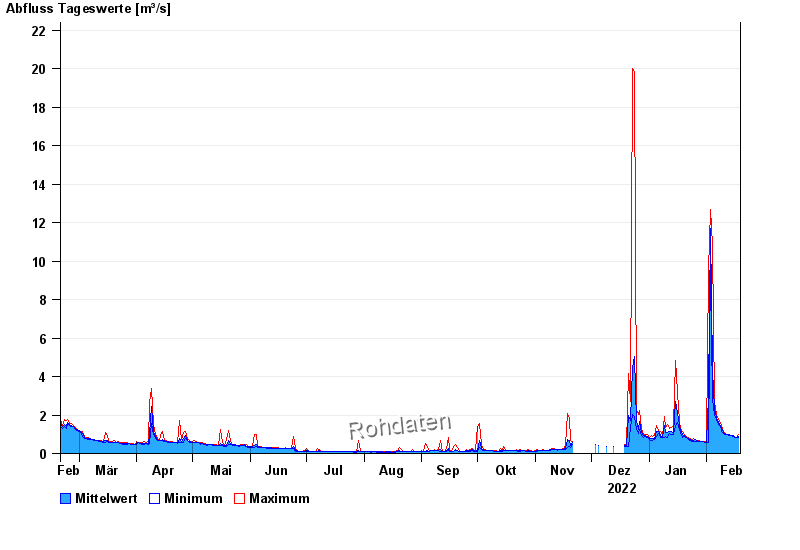
| Date | Mean value [m³/s] | Maximum [m³/s] | Minimum [m³/s] |
|---|---|---|---|
| 18.02.2023 | 0.893 | 1.01 | 0.808 |
| 17.02.2023 | 0.818 | 0.857 | 0.808 |
| 16.02.2023 | 0.86 | 0.899 | 0.808 |
| 15.02.2023 | 0.917 | 0.955 | 0.899 |
| 14.02.2023 | 0.955 | 0.955 | 0.955 |
| 13.02.2023 | 0.974 | 1.01 | 0.955 |
| 12.02.2023 | 1.01 | 1.01 | 1.01 |
© Bayerisches Landesamt für Umwelt 2024