

Chart of year Büg / Schwabach
Discharge from 27.09.2020 to 26.09.2021
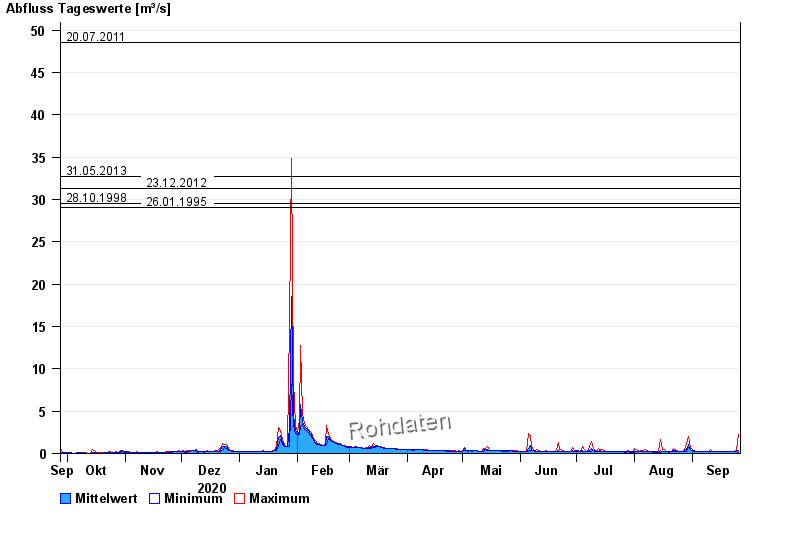
- 20.07.2011 Abfluss: 48,5 m³/s
- 31.05.2013 Abfluss: 32,7 m³/s
- 23.12.2012 Abfluss: 31,3 m³/s
- 28.10.1998 Abfluss: 29,5 m³/s
- 26.01.1995 Abfluss: 29 m³/s
| Date | Mean value [m³/s] | Maximum [m³/s] | Minimum [m³/s] |
|---|---|---|---|
| 26.09.2021 | 0.342 | 2.25 | 0.156 |
| 25.09.2021 | 0.212 | 0.355 | 0.193 |
| 24.09.2021 | 0.19 | 0.207 | 0.18 |
| 23.09.2021 | 0.206 | 0.222 | 0.193 |
| 22.09.2021 | 0.207 | 0.237 | 0.193 |
| 21.09.2021 | 0.207 | 0.221 | 0.207 |
| 20.09.2021 | 0.21 | 0.221 | 0.206 |
© Bayerisches Landesamt für Umwelt 2024