

Chart of year Büg / Schwabach
Discharge from 19.02.2020 to 18.02.2021
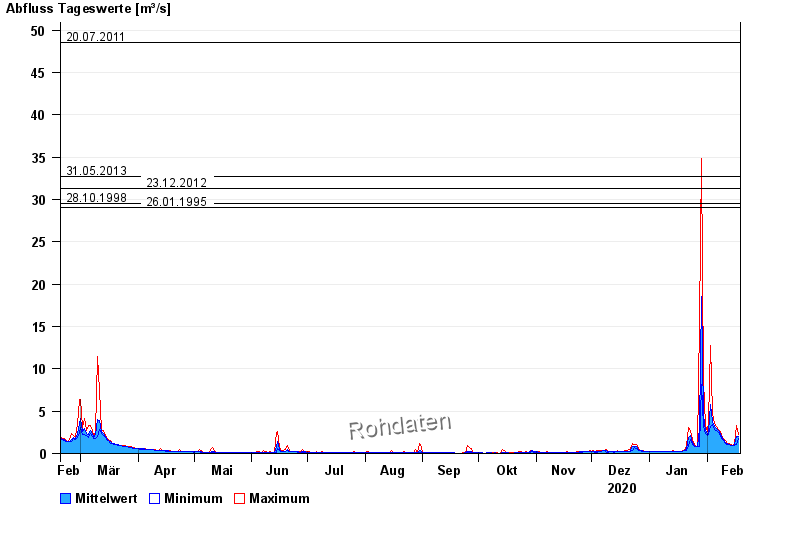
- 20.07.2011 Abfluss: 48,5 m³/s
- 31.05.2013 Abfluss: 32,7 m³/s
- 23.12.2012 Abfluss: 31,3 m³/s
- 28.10.1998 Abfluss: 29,5 m³/s
- 26.01.1995 Abfluss: 29 m³/s
| Date | Mean value [m³/s] | Maximum [m³/s] | Minimum [m³/s] |
|---|---|---|---|
| 18.02.2021 | 1.98 | 2.2 | 1.83 |
| 17.02.2021 | 1.96 | 3.34 | 1.11 |
| 16.02.2021 | 1.06 | 1.17 | 0.945 |
| 15.02.2021 | 0.985 | 0.995 | 0.938 |
| 14.02.2021 | 0.993 | 1.09 | 0.93 |
| 13.02.2021 | 1.06 | 1.14 | 1.03 |
| 12.02.2021 | 1.15 | 1.19 | 1.07 |
© Bayerisches Landesamt für Umwelt 2024