

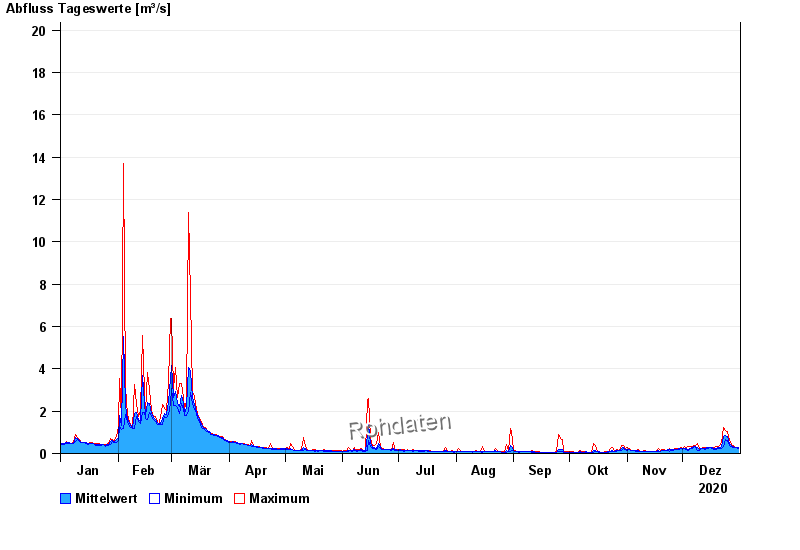
Chart of year Büg / Schwabach
Discharge from 01.01.2020 to 31.12.2020
- 20.07.2011 Abfluss: 48,5 m³/s
- 31.05.2013 Abfluss: 32,7 m³/s
- 23.12.2012 Abfluss: 31,3 m³/s
- 28.10.1998 Abfluss: 29,5 m³/s
- 26.01.1995 Abfluss: 29 m³/s
| Date | Mean value [m³/s] | Maximum [m³/s] | Minimum [m³/s] |
|---|---|---|---|
| 31.12.2020 | 0.267 | 0.271 | 0.252 |
| 30.12.2020 | 0.272 | 0.283 | 0.263 |
| 29.12.2020 | 0.294 | 0.301 | 0.277 |
| 28.12.2020 | 0.323 | 0.36 | 0.295 |
| 27.12.2020 | 0.367 | 0.412 | 0.332 |
| 26.12.2020 | 0.464 | 0.607 | 0.379 |
| 25.12.2020 | 0.803 | 1.06 | 0.606 |
© Bayerisches Landesamt für Umwelt 2024