

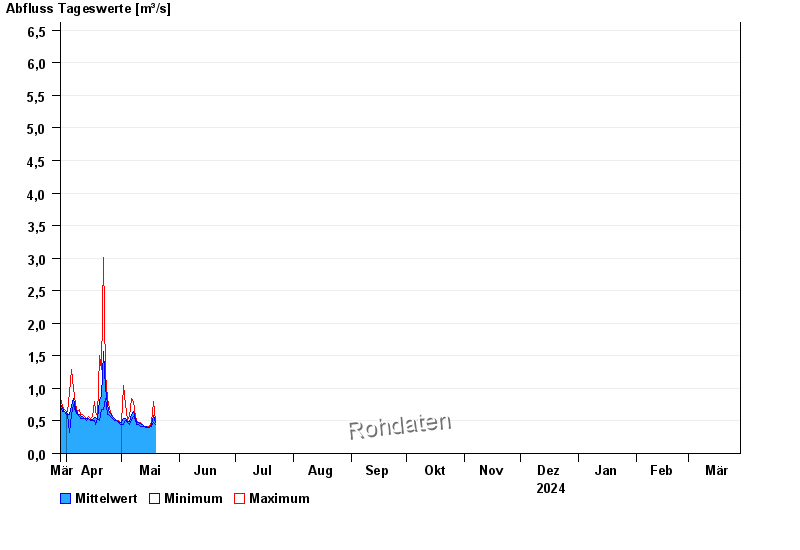
Chart of year Büg / Schwabach
Discharge from 29.03.2024 to 28.03.2025
- HQ1 15,9 m³/s
- HQ2 20,6 m³/s
- HQ5 28,6 m³/s
- HQ10 34,6 m³/s
- HQ20 40,4 m³/s
- HQ50 48,5 m³/s
- HQ100 55 m³/s
| Date | Mean value [m³/s] | Maximum [m³/s] | Minimum [m³/s] |
|---|---|---|---|
| 08.05.2024 | 0.558 | 0.57 | 0.537 |
| 07.05.2024 | 0.641 | 0.8 | 0.57 |
| 06.05.2024 | 0.599 | 0.848 | 0.506 |
| 05.05.2024 | 0.489 | 0.57 | 0.449 |
| 04.05.2024 | 0.481 | 0.506 | 0.477 |
| 03.05.2024 | 0.545 | 0.758 | 0.506 |
| 02.05.2024 | 0.545 | 1.05 | 0.449 |
© Bayerisches Landesamt für Umwelt 2024