

Chart of year Büg / Schwabach
Discharge from 27.09.2021 to 26.09.2022
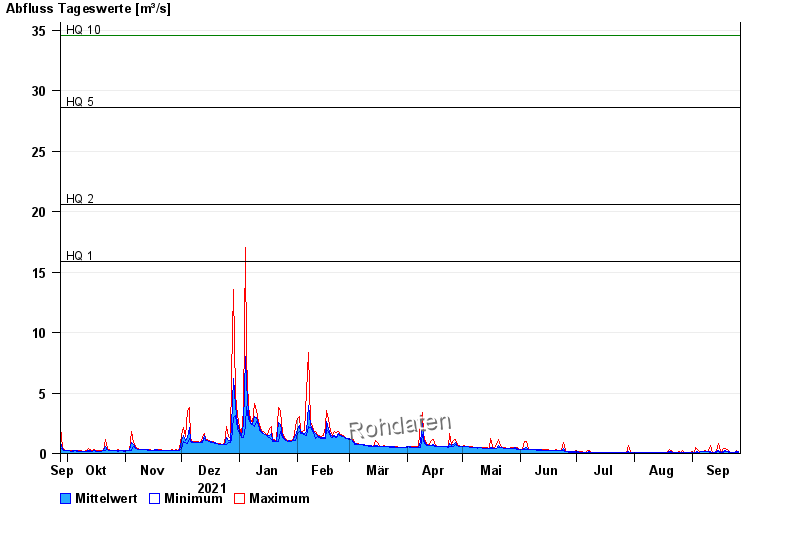
- HQ1 15,9 m³/s
- HQ2 20,6 m³/s
- HQ5 28,6 m³/s
- HQ10 34,6 m³/s
- HQ20 40,4 m³/s
- HQ50 48,5 m³/s
- HQ100 55 m³/s
| Date | Mean value [m³/s] | Maximum [m³/s] | Minimum [m³/s] |
|---|---|---|---|
| 26.09.2022 | 0.13 | 0.17 | 0.114 |
| 25.09.2022 | 0.133 | 0.214 | 0.105 |
| 24.09.2022 | 0.105 | 0.105 | 0.097 |
| 23.09.2022 | 0.105 | 0.105 | 0.105 |
| 22.09.2022 | 0.113 | 0.114 | 0.105 |
| 21.09.2022 | 0.126 | 0.145 | 0.114 |
| 20.09.2022 | 0.175 | 0.29 | 0.145 |
© Bayerisches Landesamt für Umwelt 2024