

Chart of year Büg / Schwabach
Discharge from 24.10.2022 to 23.10.2023
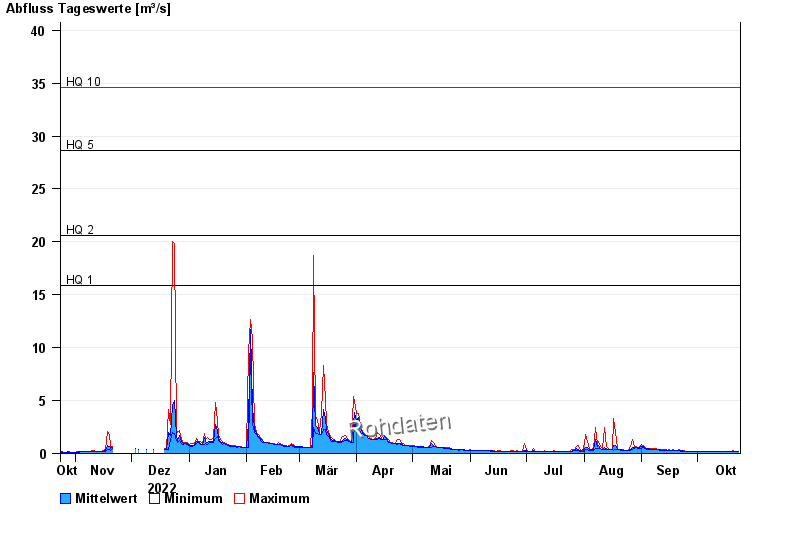
- HQ1 15,9 m³/s
- HQ2 20,6 m³/s
- HQ5 28,6 m³/s
- HQ10 34,6 m³/s
- HQ20 40,4 m³/s
- HQ50 48,5 m³/s
- HQ100 55 m³/s
| Date | Mean value [m³/s] | Maximum [m³/s] | Minimum [m³/s] |
|---|---|---|---|
| 23.10.2023 | 0.189 | 0.189 | 0.189 |
| 22.10.2023 | 0.195 | 0.203 | 0.189 |
| 21.10.2023 | 0.216 | 0.233 | 0.176 |
| 20.10.2023 | 0.21 | 0.249 | 0.164 |
| 19.10.2023 | 0.205 | 0.218 | 0.189 |
| 18.10.2023 | 0.19 | 0.203 | 0.189 |
| 17.10.2023 | 0.189 | 0.203 | 0.176 |
© Bayerisches Landesamt für Umwelt 2024