

Chart of year Büg / Schwabach
Discharge from 24.10.2018 to 23.10.2019
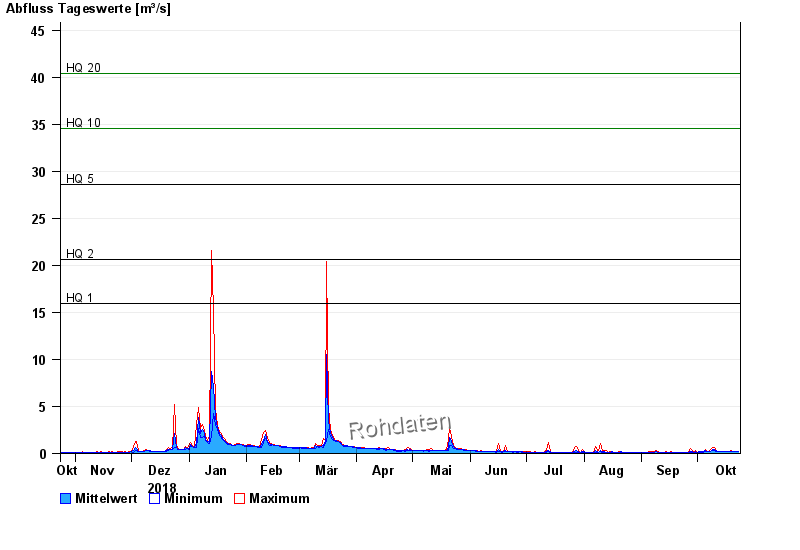
- HQ1 15,9 m³/s
- HQ2 20,6 m³/s
- HQ5 28,6 m³/s
- HQ10 34,6 m³/s
- HQ20 40,4 m³/s
- HQ50 48,5 m³/s
- HQ100 55 m³/s
| Date | Mean value [m³/s] | Maximum [m³/s] | Minimum [m³/s] |
|---|---|---|---|
| 23.10.2019 | 0.19 | 0.202 | 0.188 |
| 22.10.2019 | 0.197 | 0.216 | 0.187 |
| 21.10.2019 | 0.206 | 0.247 | 0.201 |
| 20.10.2019 | 0.233 | 0.264 | 0.215 |
| 19.10.2019 | 0.252 | 0.302 | 0.214 |
| 18.10.2019 | 0.191 | 0.214 | 0.186 |
| 17.10.2019 | 0.189 | 0.214 | 0.173 |
© Bayerisches Landesamt für Umwelt 2024