

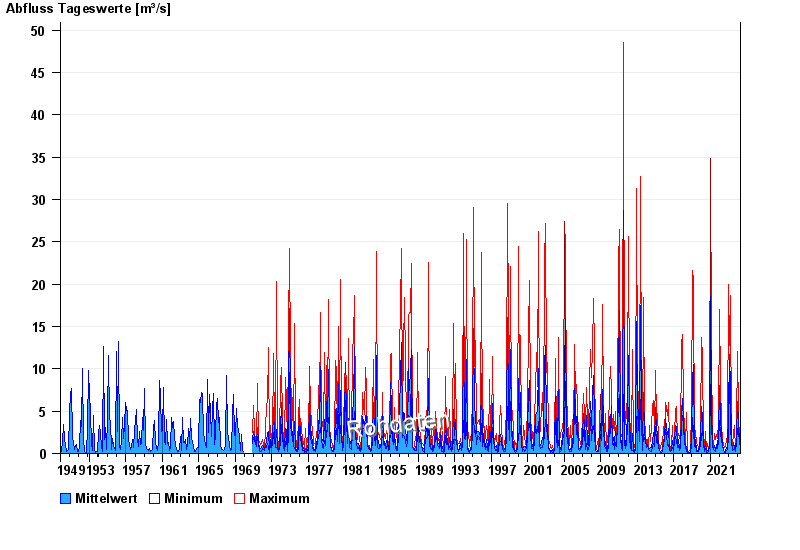
Chart of total period Büg / Schwabach
Discharge from 01.11.1949 to 27.04.2024
| Date | Mean value [m³/s] | Maximum [m³/s] | Minimum [m³/s] |
|---|---|---|---|
| 27.04.2024 | 0.537 | 0.537 | 0.537 |
| 26.04.2024 | 0.562 | 0.57 | 0.537 |
| 25.04.2024 | 0.612 | 0.64 | 0.57 |
| 24.04.2024 | 0.665 | 0.758 | 0.603 |
| 23.04.2024 | 0.774 | 0.848 | 0.603 |
| 22.04.2024 | 0.998 | 1.23 | 0.848 |
| 21.04.2024 | 1.56 | 3.01 | 0.677 |
© Bayerisches Landesamt für Umwelt 2024