

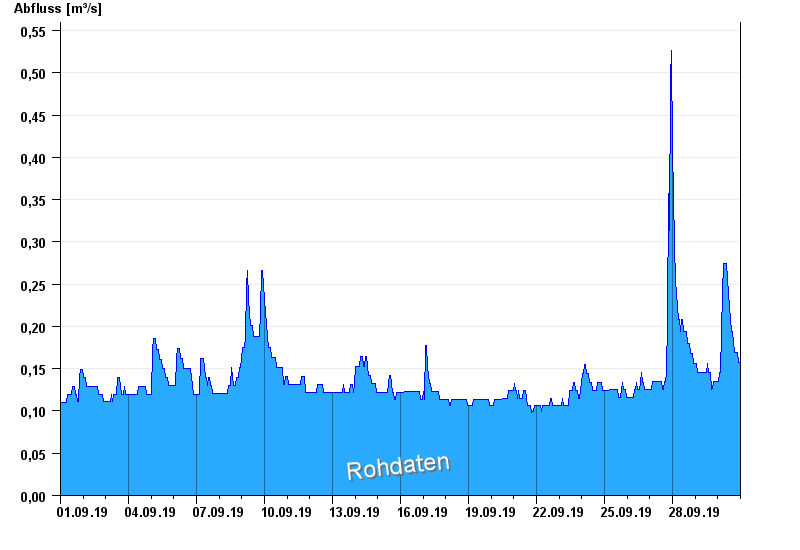
Chart of month Büg / Schwabach
Discharge from 01.09.2019 to 30.09.2019
- 20.07.2011 Abfluss: 48,5 m³/s
- 31.05.2013 Abfluss: 32,7 m³/s
- 23.12.2012 Abfluss: 31,3 m³/s
- 28.10.1998 Abfluss: 29,5 m³/s
- 26.01.1995 Abfluss: 29 m³/s
| Date | Runoff [m³/s] |
|---|---|
| 01.10.2019 00:45 | 0.157 |
| 01.10.2019 00:30 | 0.157 |
| 01.10.2019 00:15 | 0.157 |
| 01.10.2019 00:00 | 0.157 |
| 30.09.2019 23:45 | 0.157 |
| 30.09.2019 23:30 | 0.157 |
| 30.09.2019 23:15 | 0.157 |
© Bayerisches Landesamt für Umwelt 2024