

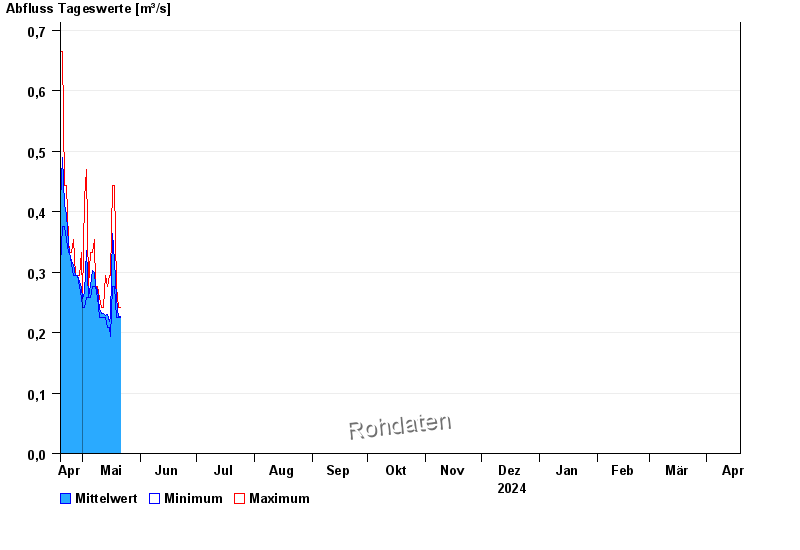
Chart of year Bruckberg / Haselbach
Discharge from 19.04.2024 to 18.04.2025
- 08.01.2011 Abfluss: 14,3 m³/s
- 22.01.2012 Abfluss: 13,9 m³/s
- 21.12.1993 Abfluss: 12,7 m³/s
- 13.01.2011 Abfluss: 12,1 m³/s
- 13.04.1994 Abfluss: 12 m³/s
| Date | Mean value [m³/s] | Maximum [m³/s] | Minimum [m³/s] |
|---|---|---|---|
| 01.05.2024 | 0.258 | 0.258 | 0.258 |
| 30.04.2024 | 0.274 | 0.333 | 0.258 |
| 29.04.2024 | 0.285 | 0.294 | 0.276 |
| 28.04.2024 | 0.294 | 0.294 | 0.294 |
| 27.04.2024 | 0.294 | 0.294 | 0.294 |
| 26.04.2024 | 0.312 | 0.354 | 0.294 |
| 25.04.2024 | 0.317 | 0.333 | 0.313 |
© Bayerisches Landesamt für Umwelt 2024