

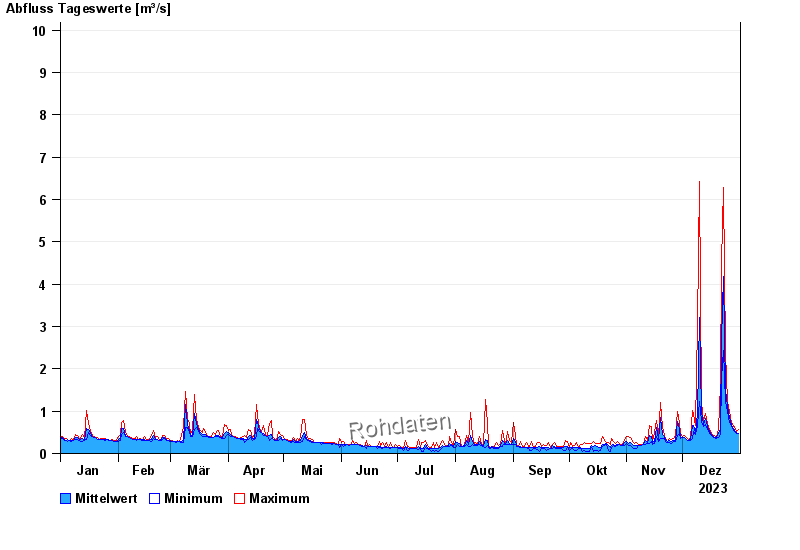
Chart of year Bruckberg / Haselbach
Discharge from 01.01.2023 to 31.12.2023
- 08.01.2011 Abfluss: 14,3 m³/s
- 22.01.2012 Abfluss: 13,9 m³/s
- 21.12.1993 Abfluss: 12,7 m³/s
- 13.01.2011 Abfluss: 12,1 m³/s
- 13.04.1994 Abfluss: 12 m³/s
| Date | Mean value [m³/s] | Maximum [m³/s] | Minimum [m³/s] |
|---|---|---|---|
| 31.12.2023 | 0.479 | 0.576 | 0.469 |
| 30.12.2023 | 0.501 | 0.521 | 0.469 |
| 29.12.2023 | 0.534 | 0.634 | 0.521 |
| 28.12.2023 | 0.591 | 0.634 | 0.549 |
| 27.12.2023 | 0.673 | 0.723 | 0.634 |
| 26.12.2023 | 0.858 | 0.989 | 0.723 |
| 25.12.2023 | 1.11 | 1.24 | 0.989 |
© Bayerisches Landesamt für Umwelt 2024