
- Start >
- Rivers >
- Discharge >
- Regnitz >
- Birkenfeld >
- Chart of year

Chart of year Birkenfeld / Aisch
Discharge from 29.03.2024 to 28.03.2025
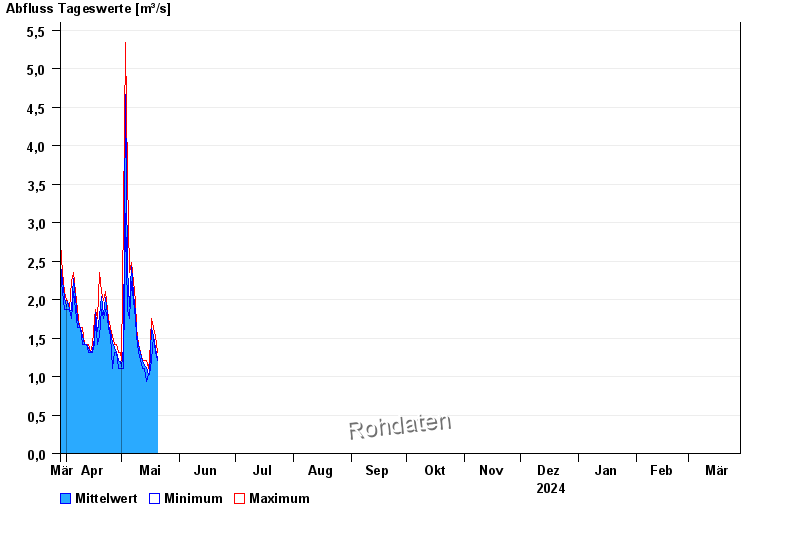
| Date | Mean value [m³/s] | Maximum [m³/s] | Minimum [m³/s] |
|---|---|---|---|
| 09.05.2024 | 1.64 | 1.64 | 1.64 |
| 08.05.2024 | 1.83 | 1.99 | 1.75 |
| 07.05.2024 | 2.07 | 2.23 | 1.99 |
| 06.05.2024 | 2.43 | 2.48 | 2.23 |
| 05.05.2024 | 1.91 | 2.35 | 1.75 |
| 04.05.2024 | 2.41 | 3.61 | 1.87 |
| 03.05.2024 | 4.66 | 5.34 | 3.12 |
© Bayerisches Landesamt für Umwelt 2024