

Chart of year Bechhofen / Wieseth
Discharge from 01.01.2024 to 03.05.2024
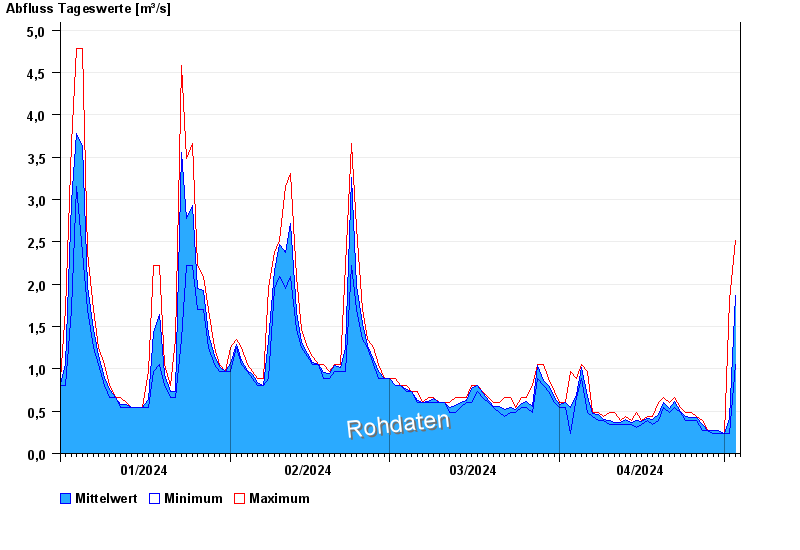
| Date | Mean value [m³/s] | Maximum [m³/s] | Minimum [m³/s] |
|---|---|---|---|
| 03.05.2024 | 2.34 | 2.52 | 1.95 |
| 02.05.2024 | 0.411 | 1.82 | 0.24 |
| 01.05.2024 | 0.24 | 0.24 | 0.24 |
| 30.04.2024 | 0.269 | 0.272 | 0.24 |
| 29.04.2024 | 0.266 | 0.272 | 0.24 |
| 28.04.2024 | 0.272 | 0.272 | 0.272 |
| 27.04.2024 | 0.341 | 0.389 | 0.272 |
© Bayerisches Landesamt für Umwelt 2024