

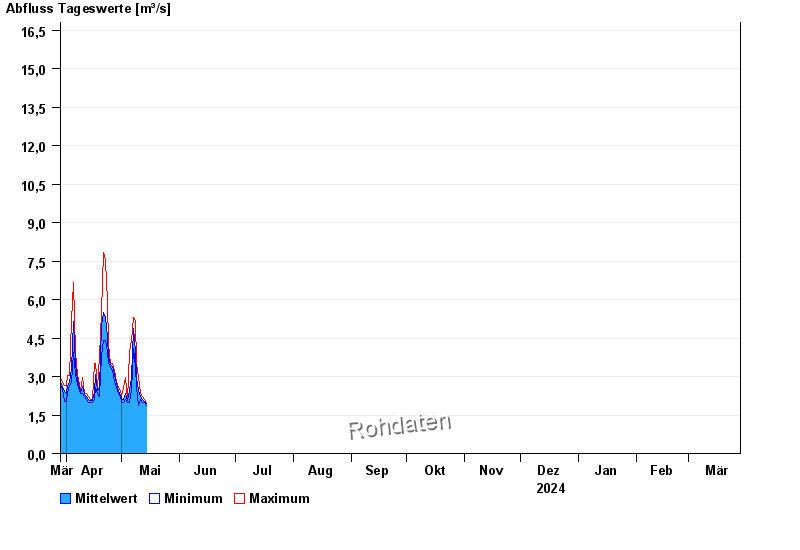
Chart of year Arzberg / Röslau
Discharge from 29.03.2024 to 28.03.2025
- HQ1 42 m³/s
- HQ2 54 m³/s
- HQ5 75 m³/s
- HQ10 90 m³/s
- HQ20 105 m³/s
- HQ50 124 m³/s
- HQ100 140 m³/s
| Date | Mean value [m³/s] | Maximum [m³/s] | Minimum [m³/s] |
|---|---|---|---|
| 09.05.2024 | 3.18 | 3.5 | 2.95 |
| 08.05.2024 | 3.98 | 5.13 | 3.36 |
| 07.05.2024 | 4.86 | 5.31 | 4.1 |
| 06.05.2024 | 2.97 | 4.42 | 2.45 |
| 05.05.2024 | 2.46 | 3.95 | 1.98 |
| 04.05.2024 | 2.07 | 2.1 | 1.98 |
| 03.05.2024 | 2.32 | 2.95 | 2.1 |
© Bayerisches Landesamt für Umwelt 2024