

Chart of year Arzberg / Röslau
Discharge from 01.01.2022 to 31.12.2022
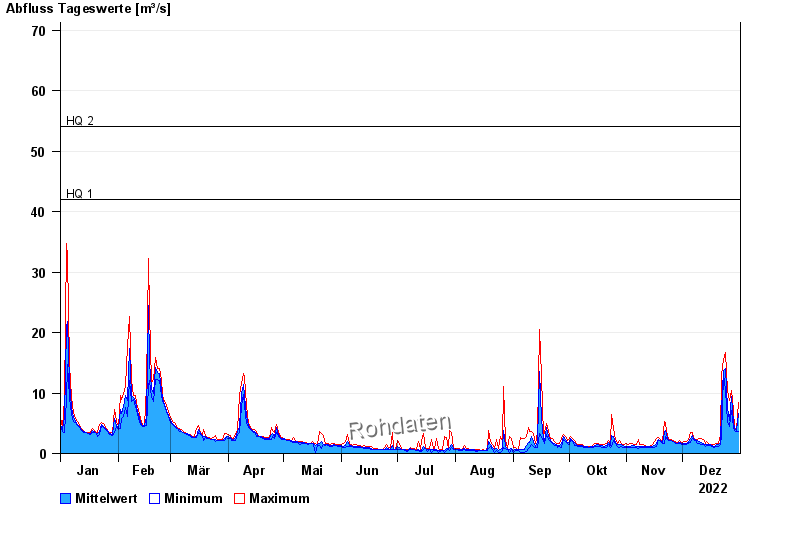
- HQ1 42 m³/s
- HQ2 54 m³/s
- HQ5 75 m³/s
- HQ10 90 m³/s
- HQ20 105 m³/s
- HQ50 124 m³/s
- HQ100 140 m³/s
| Date | Mean value [m³/s] | Maximum [m³/s] | Minimum [m³/s] |
|---|---|---|---|
| 31.12.2022 | 6.34 | 8.03 | 3.4 |
| 30.12.2022 | 3.55 | 3.71 | 3.4 |
| 29.12.2022 | 3.91 | 4.2 | 3.57 |
| 28.12.2022 | 4.94 | 6.92 | 4.2 |
| 27.12.2022 | 9.14 | 10.2 | 6.92 |
| 26.12.2022 | 5.27 | 8.83 | 4.41 |
| 25.12.2022 | 7.37 | 10.3 | 5.13 |
© Bayerisches Landesamt für Umwelt 2024