

Chart of year Arzberg / Röslau
Discharge from 01.01.2019 to 31.12.2019
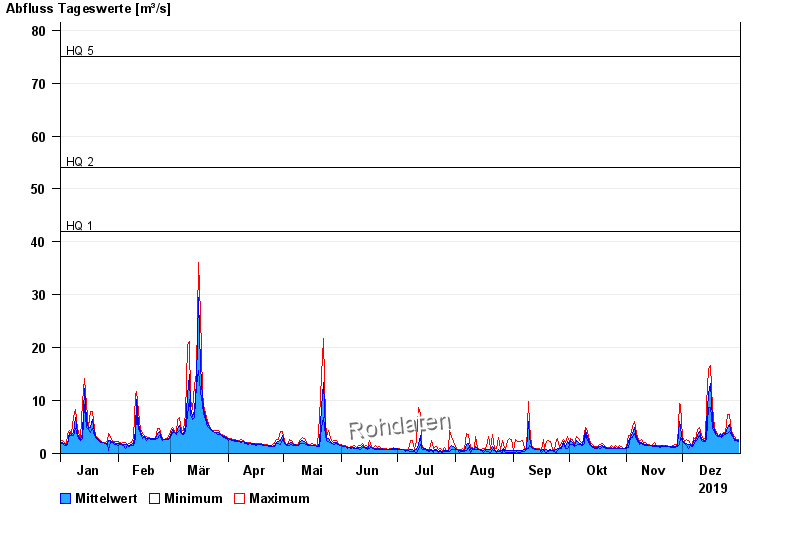
- HQ1 42 m³/s
- HQ2 54 m³/s
- HQ5 75 m³/s
- HQ10 90 m³/s
- HQ20 105 m³/s
- HQ50 124 m³/s
- HQ100 140 m³/s
| Date | Mean value [m³/s] | Maximum [m³/s] | Minimum [m³/s] |
|---|---|---|---|
| 31.12.2019 | 2.34 | 2.44 | 2.21 |
| 30.12.2019 | 2.43 | 2.57 | 2.33 |
| 29.12.2019 | 2.63 | 3.08 | 2.33 |
| 28.12.2019 | 2.98 | 3.22 | 2.82 |
| 27.12.2019 | 3.64 | 4.1 | 3.22 |
| 26.12.2019 | 5.37 | 7.21 | 4.1 |
| 25.12.2019 | 4.81 | 7.21 | 3.79 |
© Bayerisches Landesamt für Umwelt 2024