

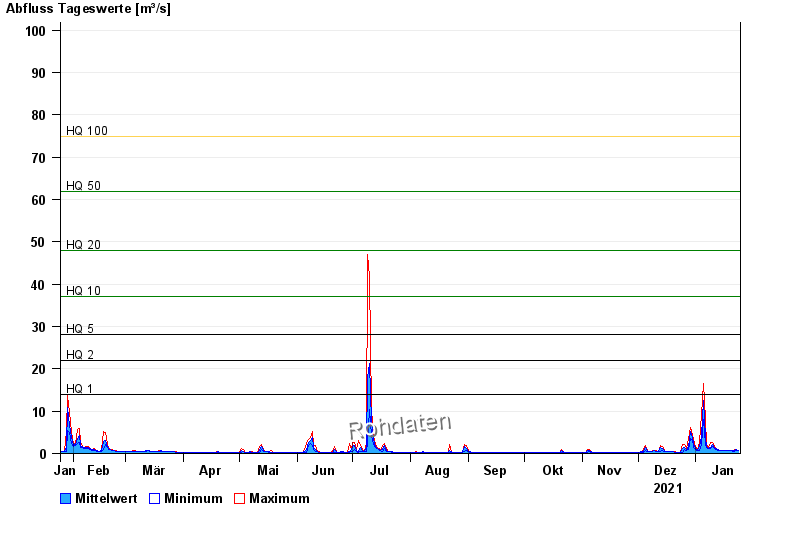
Chart of year Ansbach / Fränkische Rezat
Discharge from 25.01.2021 to 24.01.2022
note
Wasserstand und Abfluss wird zeitweise durch Biberdamm beeinflusst.
- HQ1 14 m³/s
- HQ2 22 m³/s
- HQ5 28 m³/s
- HQ10 37 m³/s
- HQ20 48 m³/s
- HQ50 62 m³/s
- HQ100 75 m³/s
| Date | Mean value [m³/s] | Maximum [m³/s] | Minimum [m³/s] |
|---|---|---|---|
| 24.01.2022 | 0.723 | 0.814 | 0.674 |
| 23.01.2022 | 0.92 | 0.957 | 0.814 |
| 22.01.2022 | 0.644 | 0.911 | 0.586 |
| 21.01.2022 | 0.627 | 0.674 | 0.586 |
| 20.01.2022 | 0.674 | 0.674 | 0.674 |
| 19.01.2022 | 0.674 | 0.674 | 0.674 |
| 18.01.2022 | 0.661 | 0.674 | 0.63 |
© Bayerisches Landesamt für Umwelt 2024