

Chart of year Aha / Altmühl
Discharge from 01.01.2024 to 26.04.2024
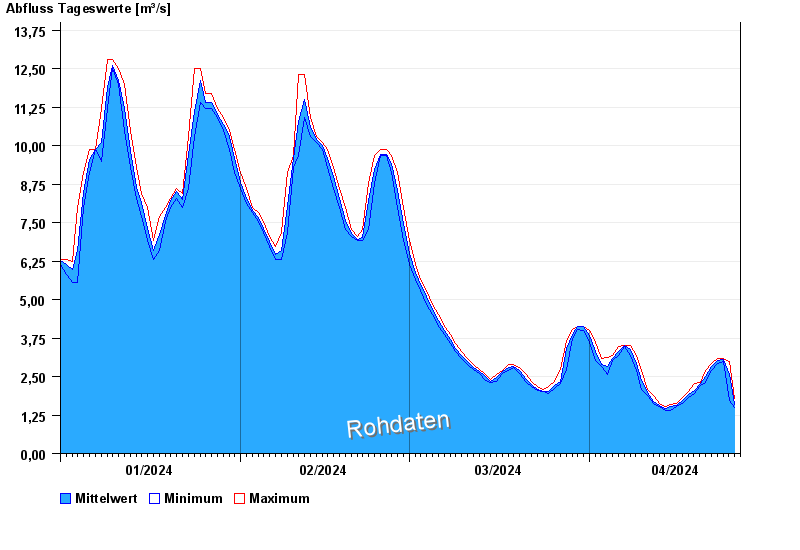
| Date | Mean value [m³/s] | Maximum [m³/s] | Minimum [m³/s] |
|---|---|---|---|
| 26.04.2024 | 1.6 | 1.68 | 1.56 |
| 25.04.2024 | 2.6 | 2.98 | 1.71 |
| 24.04.2024 | 3.05 | 3.08 | 2.98 |
| 23.04.2024 | 3.01 | 3.08 | 2.93 |
| 22.04.2024 | 2.81 | 2.93 | 2.7 |
| 21.04.2024 | 2.5 | 2.7 | 2.3 |
| 20.04.2024 | 2.26 | 2.3 | 2.21 |
© Bayerisches Landesamt für Umwelt 2024