

Chart of total period Aeschach / Oberreitnauer Ach
Discharge from 01.11.2009 to 01.05.2024
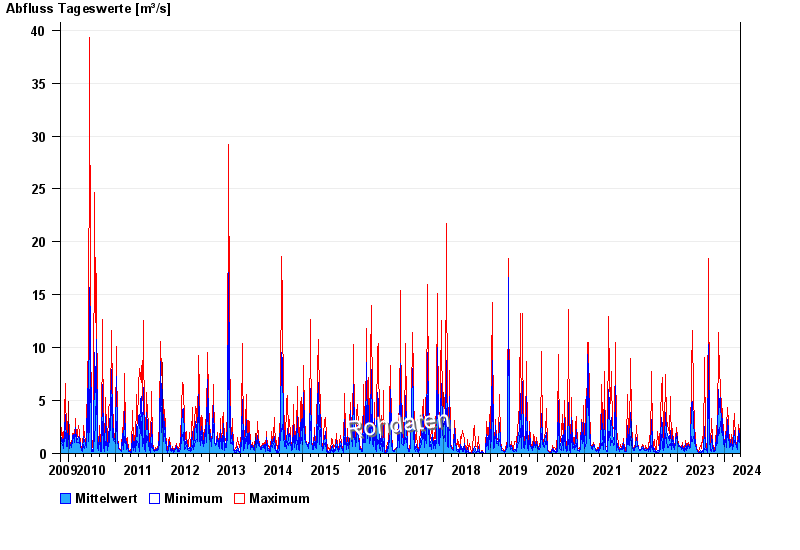
| Date | Mean value [m³/s] | Maximum [m³/s] | Minimum [m³/s] |
|---|---|---|---|
| 01.05.2024 | 0.309 | 0.311 | 0.291 |
| 30.04.2024 | 0.33 | 0.333 | 0.311 |
| 29.04.2024 | 0.357 | 0.378 | 0.333 |
| 28.04.2024 | 0.398 | 0.427 | 0.378 |
| 27.04.2024 | 0.452 | 0.477 | 0.427 |
| 26.04.2024 | 0.543 | 0.585 | 0.477 |
| 25.04.2024 | 0.642 | 0.703 | 0.585 |
© Bayerisches Landesamt für Umwelt 2024