

Chart of year Achsheim / Schmutter
Discharge from 23.10.2022 to 22.10.2023
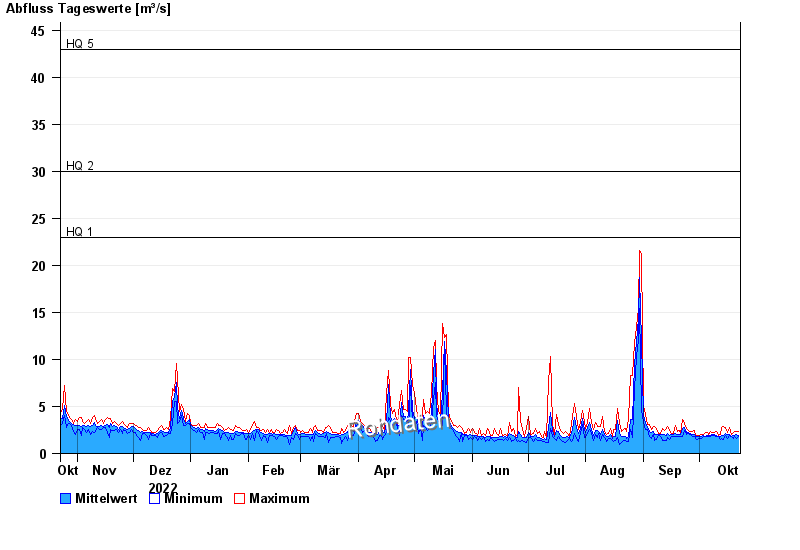
- HQ1 23 m³/s
- HQ2 30 m³/s
- HQ5 43 m³/s
- HQ10 53 m³/s
- HQ20 62 m³/s
- HQ50 77 m³/s
- HQ100 88 m³/s
| Date | Mean value [m³/s] | Maximum [m³/s] | Minimum [m³/s] |
|---|---|---|---|
| 22.10.2023 | 1.96 | 2.38 | 1.76 |
| 21.10.2023 | 1.97 | 2.38 | 1.62 |
| 20.10.2023 | 1.93 | 2.38 | 1.76 |
| 19.10.2023 | 1.94 | 2.22 | 1.62 |
| 18.10.2023 | 1.85 | 2.06 | 1.76 |
| 17.10.2023 | 2.05 | 2.74 | 1.91 |
| 16.10.2023 | 2.02 | 2.22 | 1.62 |
© Bayerisches Landesamt für Umwelt 2024