
- Start >
- Rivers >
- Discharge >
- Untere Donau >
- Zwiesel >
- Chart of year

Chart of year Zwiesel / Großer Regen
Discharge from 01.01.2024 to 31.12.2024
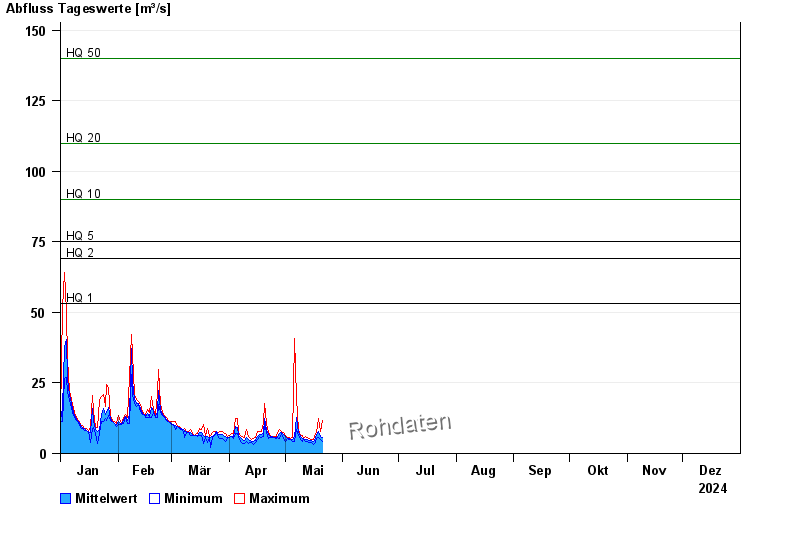
- HQ1 53 m³/s
- HQ2 69 m³/s
- HQ5 75 m³/s
- HQ10 90 m³/s
- HQ20 110 m³/s
- HQ50 140 m³/s
- HQ100 170 m³/s
| Date | Mean value [m³/s] | Maximum [m³/s] | Minimum [m³/s] |
|---|---|---|---|
| 23.05.2024 | 13.3 | 15.6 | 11.7 |
| 22.05.2024 | 26.7 | 42.1 | 15.6 |
| 21.05.2024 | 12.1 | 53.9 | 4.41 |
| 20.05.2024 | 5.95 | 7.97 | 4.79 |
| 19.05.2024 | 7.94 | 12.3 | 5.62 |
| 18.05.2024 | 6.57 | 7.47 | 5.19 |
| 17.05.2024 | 5.34 | 6.99 | 4.04 |
© Bayerisches Landesamt für Umwelt 2024